Bridge inspections, road surveys, and asset management that actually works
Europe's infrastructure inspection market represents €1.5B+ annually, growing at 7.7% CAGR as ageing assets demand increasing attention. Yet the inspection process itself remains frustratingly inefficient. Bridge inspectors waste 2-4 hours per structure on double data entry—recording findings on paper or basic tablets in the field, then transcribing everything to bridge management systems back in the office. Photo management is worse: manually downloading hundreds of images, renaming them according to element codes, and matching them to specific defects. Geocadra eliminates these inefficiencies while supporting the rigorous inspection standards that different countries require.
The Hidden Costs of Infrastructure Inspection
Inefficient inspection processes don't just waste time—they affect maintenance decisions, budget allocation, and public safety.
Double Data Entry Wastes 2-4 Hours Per Bridge
A typical principal bridge inspection takes 4-6 hours on site. Back at the office, inspectors spend another 2-4 hours transcribing handwritten notes into the bridge management system, entering condition ratings for each element, and typing up defect descriptions. This isn't productive engineering work—it's clerical transcription that introduces errors and delays reporting.
Photo Management Consumes Senior Engineer Time
A single bridge inspection might generate 100+ photos documenting defects, element conditions, and overall views. Each photo needs to be downloaded from the camera, renamed according to element codes, and linked to specific defects in the management system. Senior engineers—who should be analysing conditions and recommending interventions—instead spend hours on photo administration.
Field Crews Carry Too Much Equipment
Traditional bridge inspection requires paper forms, cameras, reference manuals, measuring equipment, and safety gear. Inspectors juggle multiple devices while working in challenging positions—under bridges, on rope access, in confined spaces. Important observations get missed or poorly documented because writing notes while maintaining safety is difficult.
Different Countries Require Different Standards
German inspections follow DIN 1076 with specific element classifications and condition ratings. French inspections use IQOA methodology with different assessment criteria. UK highways authorities have their own requirements. Consultancies working across borders need systems that adapt to multiple inspection standards without starting from scratch each time.
Tracking Condition Changes Across Inspection Cycles
Effective asset management requires understanding how conditions change over time. Yet comparing current findings to previous inspections often means hunting through years of PDF reports, trying to identify whether that crack has grown or that corrosion has progressed. Without systematic historical comparison, maintenance decisions rely on incomplete information.
There's a better way. →
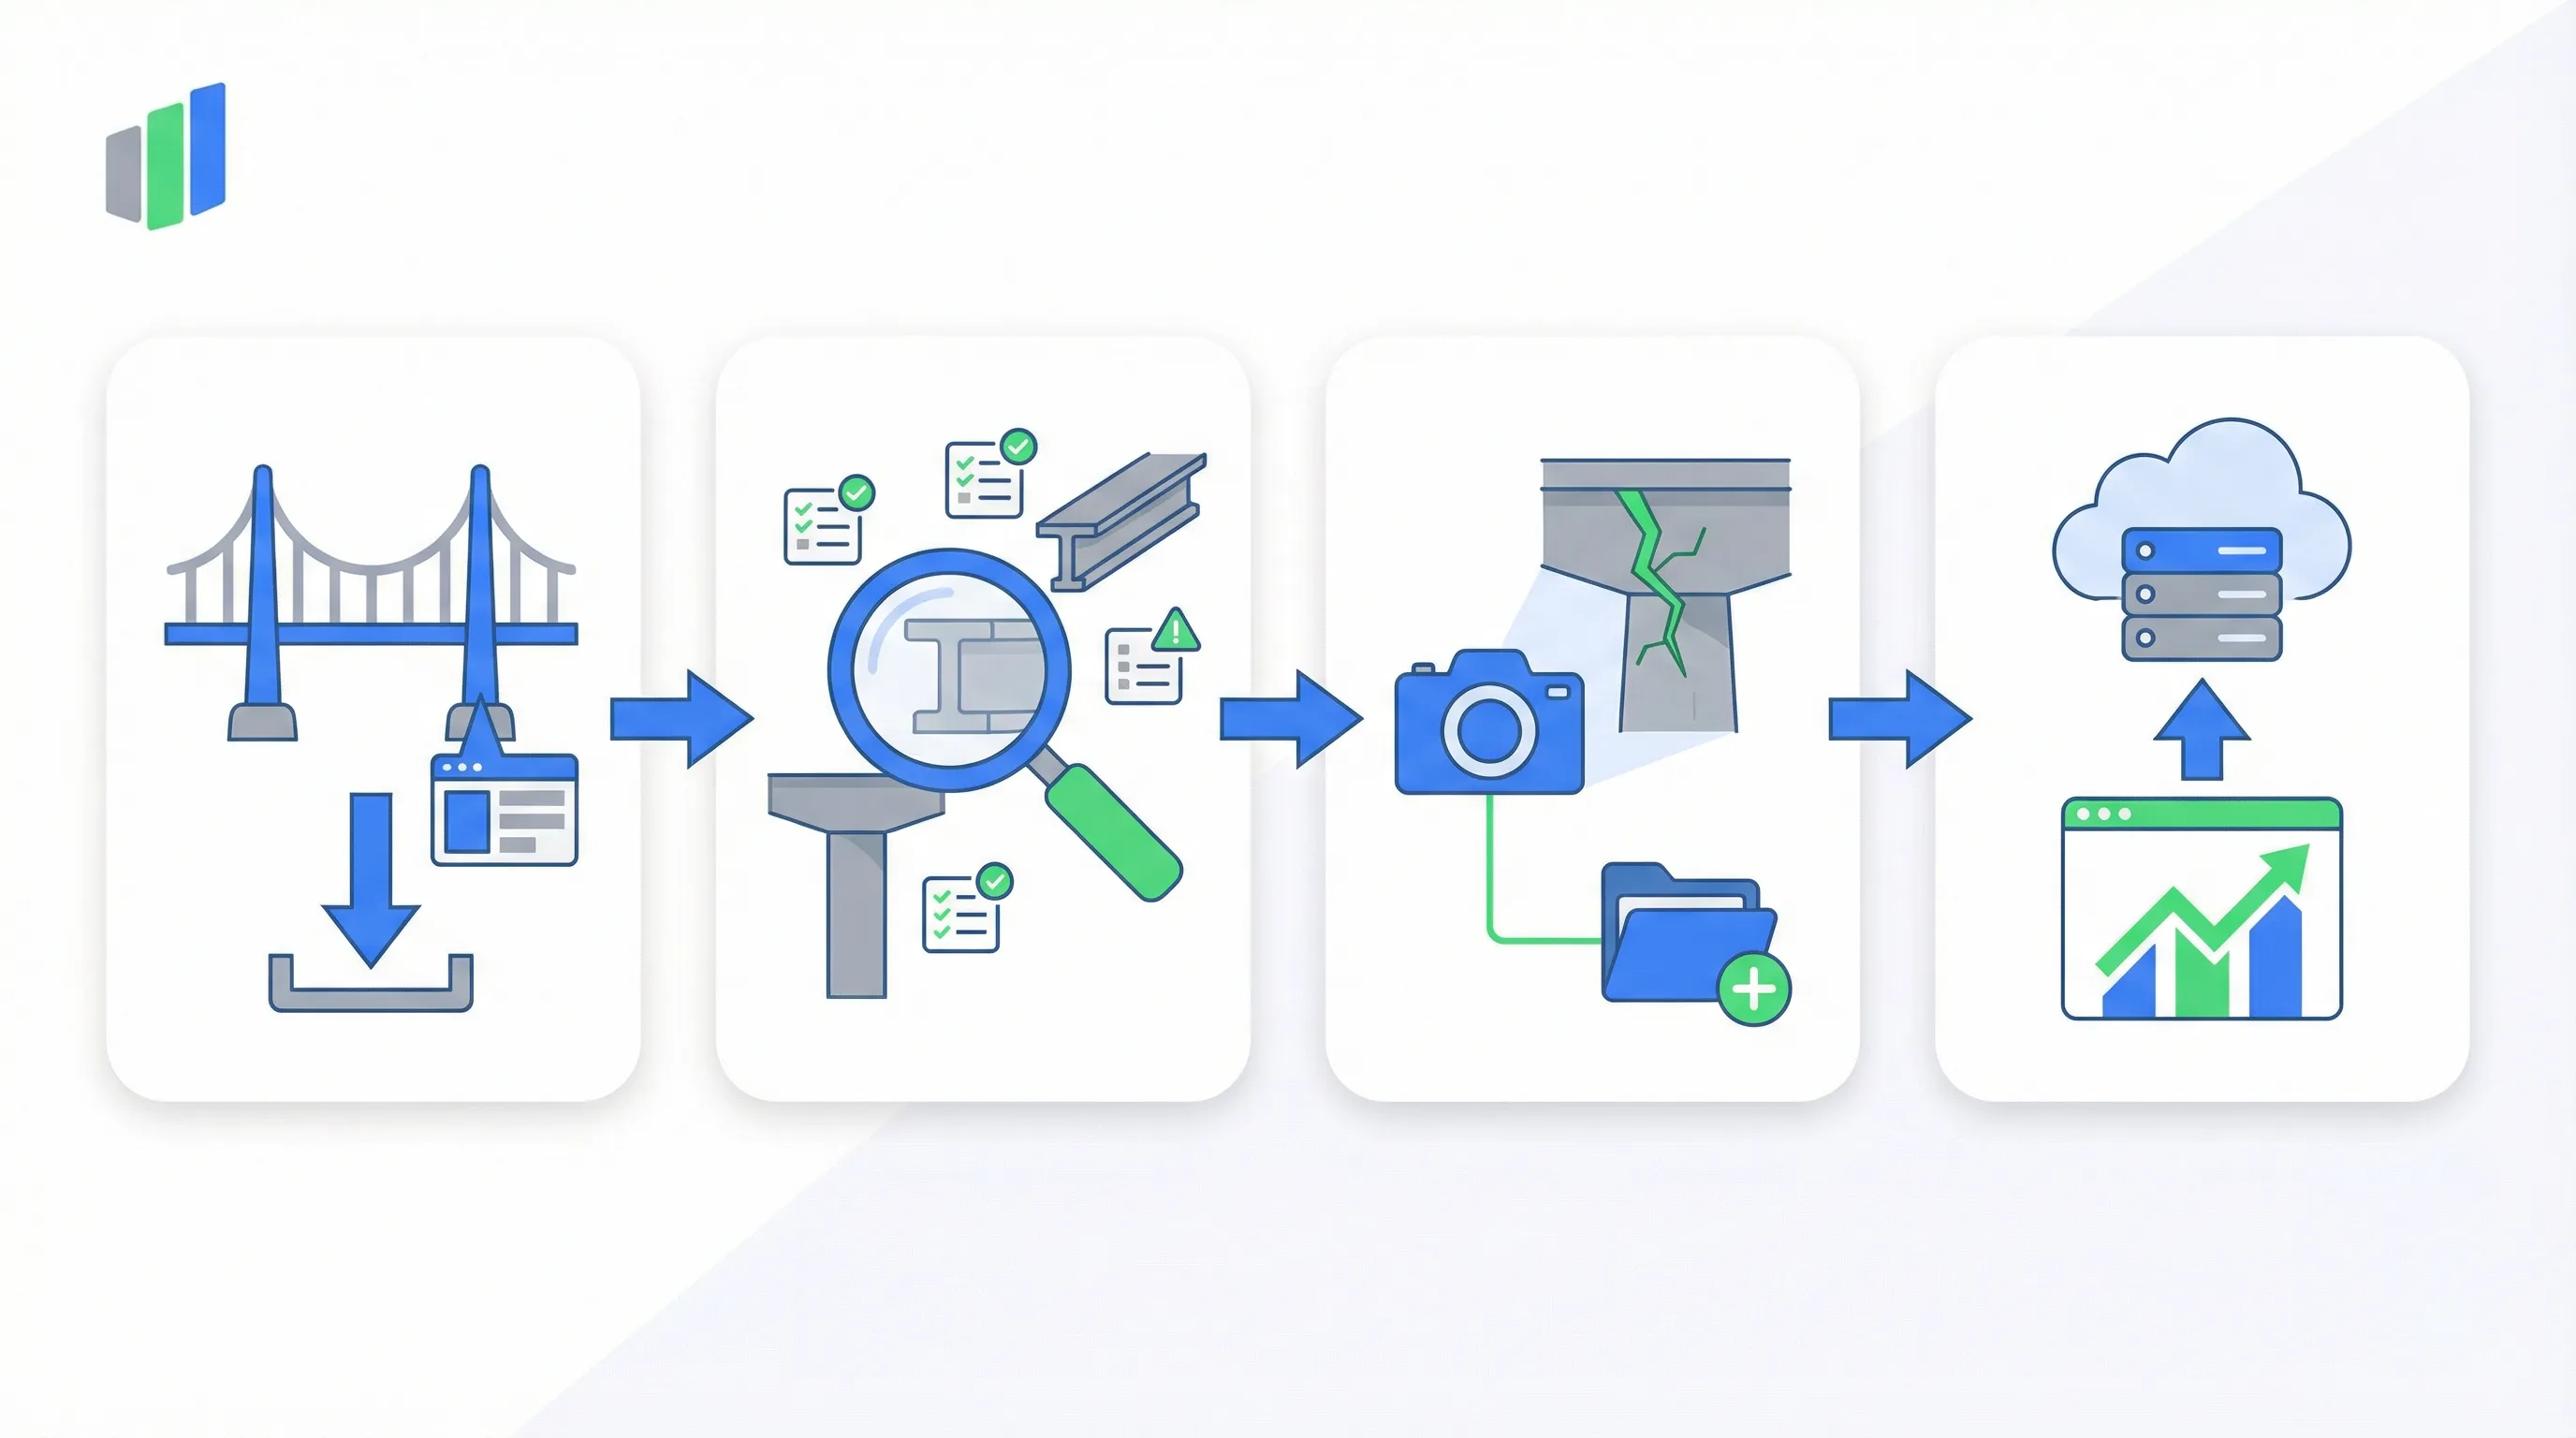
How Geocadra Streamlines Infrastructure Inspection
Designed for the specific challenges of bridge, road, and structure inspection, not adapted from generic forms software.
Element-Level Data Flows Directly to Your BMS
Capture condition ratings, defect observations, and element measurements in structured forms that match your bridge management system requirements. Export in formats ready for direct import—no transcription, no re-entry, no errors from manual data handling. What took 2-4 hours of office work now happens automatically.
Photos Automatically Linked to Elements and Defects
Every photo taken within Geocadra automatically attaches to the current inspection element with GPS coordinates, timestamp, and inspector identification. No more downloading, renaming, and matching hundreds of images. Export photo reports organised by element code, ready for your documentation system.
One Device Replaces Paper, Camera, and Manuals
Inspection forms, camera, reference materials, and reporting all live on one mobile device. Field crews work more safely with hands free for equipment operation and personal safety. Reference photos and previous inspection data available instantly when making condition assessments.
Templates for DIN 1076, IQOA, and UK Standards
Pre-built form templates follow the element classifications and rating scales of major inspection standards. Customise for specific client requirements or create your own templates for structures not covered by standard methodologies. One platform supports multiple inspection regimes.
Compare Conditions Across Inspection Cycles
View previous inspection findings alongside current observations. Identify elements with deteriorating conditions that need attention. Track defect progression over time with photo comparisons. Historical context improves engineering judgement and supports evidence-based maintenance recommendations.
Common Workflows
Here's the step-by-step process infrastructure inspection teams follow in Geocadra—from pre-inspection planning through to BMS-ready report export.
Bridge and Structure Condition Assessments
Conduct systematic element-by-element bridge inspections following DIN 1076, IQOA, or DMRB standards, with auto-linked photos and direct export to your bridge management system.
- Load the structure record in Geocadra: previous inspection data, element inventory, and location photos appear for reference. The inspection template matches your chosen standard (DIN 1076, IQOA, or custom).
- Work through each structural element systematically—abutments, piers, bearings, deck, expansion joints, parapets, drainage. For each element, assign a condition rating from the standard's scale and describe any defects observed.
- Photograph each defect and each element's general condition. Photos auto-link to the specific element record with GPS coordinates, timestamp, and inspector ID. Use measurement references in photos for defect sizing.
- Review the completed inspection on-device, checking for any missed elements. Export the full inspection report—element ratings, defect descriptions, photos, and inspector details—in a format ready for direct import into your BMS (Pontis, BRIDGIT, or custom system).
Road Surface Condition Surveys
Capture pavement condition data while driving or walking survey routes, with GPS-located defects and photos that generate network-wide condition maps.
- Load the road network sections assigned for today's survey. Geocadra displays the route with previous condition data colour-coded on the map so you can see deterioration trends before you start.
- Drive or walk the survey route with Geocadra recording your GPS track. At each defect, tap the screen to drop a point: select the defect type (pothole, cracking, rutting, ravelling, patching) from the dropdown and rate severity.
- Photograph representative defects with a measurement scale in frame. The form captures additional context: carriageway position (nearside, offside, centre), lane number, extent, and estimated area.
- Export the complete survey as a GIS dataset with condition ratings overlaid on the road network. Generate condition maps showing deterioration patterns, priority areas for maintenance, and year-on-year comparisons for asset management planning.
Tunnel Inspection Documentation
Inspect tunnel lining, drainage, mechanical ventilation, and electrical systems using structured inspection sequences with chainage-referenced observations.
- Open the tunnel inspection template and set the starting chainage. The form structures the inspection by tunnel zone (portal, approach, bore, cross-passages) and by system (lining, drainage, M&E, lighting, safety equipment).
- Walk through the tunnel recording observations at chainage intervals. For the lining: crack mapping, water ingress, spalling, and deformation. For drainage: flow rates, blockages, and sump pump operation. Each observation pins to its chainage location.
- Photograph defects with the chainage marker visible in frame. For water ingress, capture the extent and flow rate. For lining defects, include measurement references. All photos auto-link to the chainage-referenced observation record.
- Export the tunnel inspection report structured by chainage and system. Defect maps show the distribution of issues along the bore. Priority ratings feed into the maintenance planning system for scheduled intervention or emergency response.
Defect Mapping and Condition Rating
Precisely locate structural defects with GPS coordinates and photographic evidence, apply standardised severity ratings, and track defect progression across inspection cycles.
- Load the structure's defect history in Geocadra. Previously recorded defects appear on the map/drawing so you can re-locate them and assess whether they've progressed since the last inspection.
- At each defect, record precise GPS coordinates or position on the structural drawing. Classify using the standardised defect typology: cracking (type, width, length, pattern), corrosion (extent, section loss), spalling (area, depth), deformation (magnitude, direction).
- Capture measurement photos with crack gauges, rulers, or tape measures in frame. Take overview photos for context. Record environmental conditions that affect the defect: water exposure, de-icing salt contact, loading conditions.
- Compare current measurements against previous inspection data on-device. Flag defects showing active deterioration for urgent engineering review. Export the defect register with progression analysis, photos, and recommended intervention priorities.
Retaining Wall Inspections
Document retaining wall geometry, drainage condition, structural indicators, and movement monitoring data, tracking changes over time to predict intervention needs.
- Load the retaining wall record with its geometry data, construction type, and previous inspection findings. Navigate to the site and confirm the wall's extent matches the asset register.
- Inspect the wall systematically from top to bottom: crest condition, face condition (cracks, bulging, missing units, vegetation growth), drainage weep holes (flowing, blocked, staining), and toe condition (scour, undermining, ground heave).
- Record movement monitoring data at established survey points: capture tilt measurements, crack widths at monitoring stations, and any new displacement indicators. Geocadra shows previous readings for immediate comparison.
- Export the inspection report with a condition summary, movement trend analysis, and maintenance recommendations. Flag walls showing active movement or significant deterioration for engineering assessment and prioritised intervention.
Culvert and Drainage Structure Surveys
Systematically inspect culvert inlet, barrel, and outlet conditions, documenting blockages, structural deterioration, and hydraulic capacity issues.
- Navigate to the culvert using Geocadra's asset map. The record shows the culvert type, dimensions, construction material, and previous inspection data for reference before you enter the structure.
- Inspect the inlet first: headwall condition, wingwall stability, debris accumulation, and approach channel condition. Photograph the inlet from upstream showing the flow conditions and any blockage.
- Enter or view the barrel (depending on size and safety constraints): record structural condition of the invert, walls, and soffit. Document joint condition, infiltration, deformation, and any cross-sectional reduction. Photograph defects with measurement references.
- Inspect the outlet: headwall, wingwall, energy dissipation, and downstream channel condition. Record the overall hydraulic assessment and export the complete culvert survey with condition ratings, photos, and recommended maintenance actions.
Measurable Results
Compliance & Standards
Geocadra's templates support the inspection standards used across European infrastructure networks.
DIN 1076
The German bridge inspection standard DIN 1076 specifies element classifications, condition rating scales, and documentation requirements for regular and principal inspections. Geocadra's German bridge templates follow DIN 1076 structure, ensuring your inspection data meets the standard's requirements for element-level condition assessment.
IQOA
The French IQOA (Image Qualité des Ouvrages d'Art) methodology provides standardised assessment criteria for bridge structures. Our IQOA templates capture the specific ratings and observations the methodology requires, supporting consistent assessment across French infrastructure portfolios.
Eurocode
European structural design standards establish the technical basis for load capacity assessment and structural adequacy verification. Geocadra captures the field observations and measurements that support Eurocode-based structural evaluations, with export formats suitable for engineering analysis software.
UK Bridge Inspection Standards
UK highways authorities including Highways England specify inspection requirements through the Design Manual for Roads and Bridges. Our UK templates follow DMRB guidance for structure inspections, ensuring documentation meets the standards that highway maintainers require.
Frequently Asked Questions
Can Geocadra integrate with our bridge management system?
Yes. Export inspection data in formats compatible with major BMS platforms including Pontis, BRIDGIT, and custom systems. Element-level data exports match the structure your BMS expects, enabling direct import without manual reformatting.
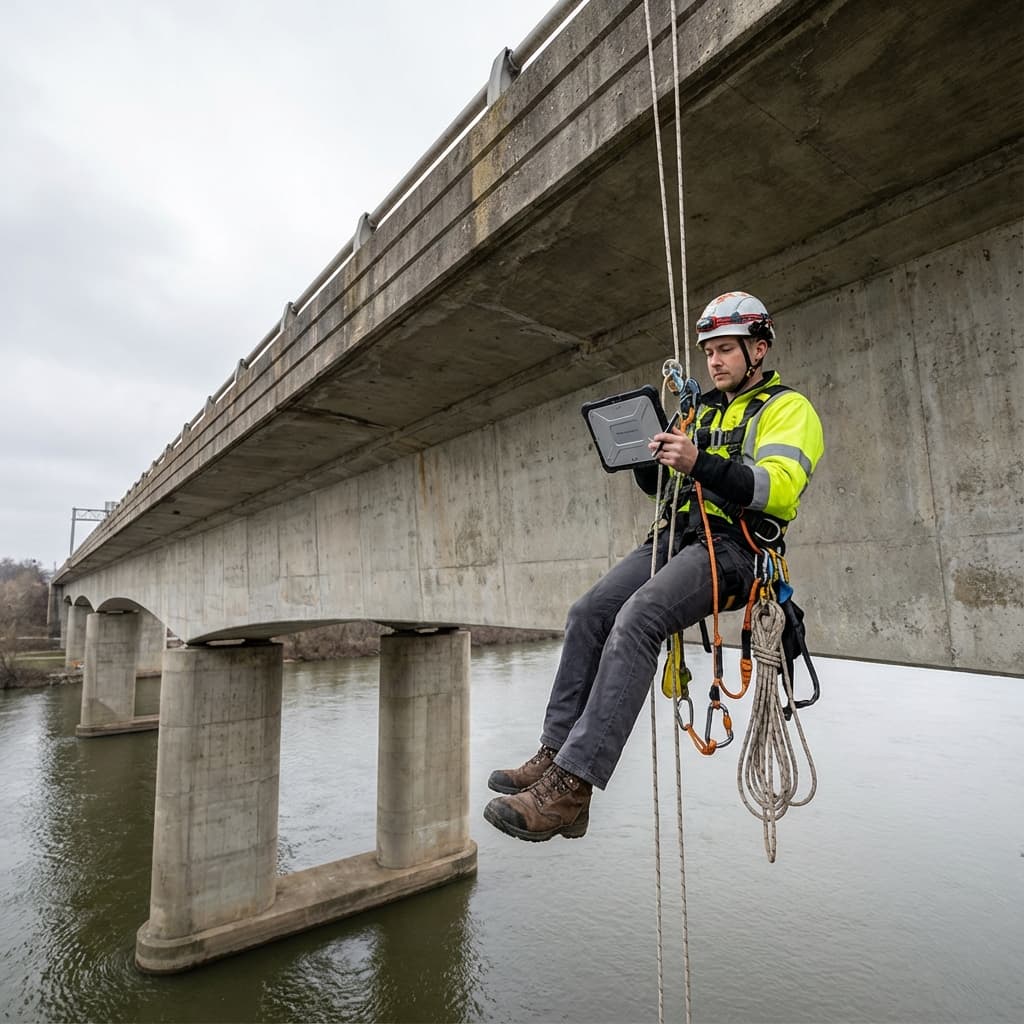
How do inspectors use Geocadra during rope access work?
The mobile interface is designed for challenging field conditions. Inspectors can operate the app one-handed, use voice notes for detailed observations, and capture photos quickly.
How does historical comparison work?
Import previous inspection data or build history from your first Geocadra inspection. During subsequent inspections, view previous condition ratings and photos alongside current observations. Export reports showing condition changes over time for maintenance planning.
How do inspection teams coordinate on large structures?
Assign specific elements or structure zones to individual inspectors. See team progress in real-time when connected. Inspection data from all team members combines into unified structure records automatically.
What GPS accuracy is achievable for defect locations?
Standard smartphone GPS provides 3-5 metre accuracy, sufficient for most inspection purposes. For high-precision requirements, Geocadra supports external Bluetooth GPS receivers achieving sub-metre accuracy with RTK correction.
Ready to transform your Infrastructure Inspection workflow?
Join teams who've already made the switch