Pole inspections, pipeline surveys, and T&D asset management made efficient
The European utility asset management market represents €1.3-2B annually, yet most field crews still waste 2-4 hours per day on double data entry. Whether you're inspecting transmission poles, surveying gas pipelines, or documenting substation equipment, the pattern is the same: collect data on paper or a basic app, return to the office, and manually transcribe everything into your asset management system. Geocadra eliminates this inefficiency by creating a direct digital pipeline from field to system, while working reliably in the underground vaults, rural substations, and remote corridors where your assets actually live.

The Real Challenges Facing Utility Field Teams
Utility infrastructure spans thousands of kilometres and decades of legacy systems. Field crews face unique obstacles that generic software simply doesn't address.
Double Data Entry Wastes Hours Every Day
Field technicians collect inspection data on clipboards, tablets, or basic apps throughout the day. Back at the office, they spend 2-4 hours re-entering that same data into Maximo, SAP, or your asset management system. This isn't just inefficient—it's where errors creep in. A mistyped pole number or transposed GPS coordinate can send maintenance crews to the wrong location, wasting even more time and money.
Coordinating Crews Across Vast Service Territories
A single distribution network might span hundreds of kilometres with dozens of technicians in the field simultaneously. Without real-time visibility, crews overlap on the same assets while others get missed entirely. Supervisors rely on end-of-day phone calls to understand progress, making it impossible to respond to urgent issues or reallocate resources efficiently.
Meeting ISO 55000 and ENTSO-E Requirements
Asset management standards require documented evidence of inspection activities, condition assessments, and maintenance decisions. Paper-based systems make audit preparation a nightmare—hunting through filing cabinets for inspection records, trying to match photos to specific assets, and hoping nothing was lost. Regulators increasingly expect digital documentation with complete chain of custody.
Enterprise Tools That Lock Out Smaller Teams
Solutions like IBM Maximo or IQGeo are powerful but come with enterprise price tags—often €50,000+ annually plus implementation costs. For smaller utilities, municipal operators, or contractors serving multiple clients, these costs are prohibitive. Yet the alternative—spreadsheets and paper forms—creates its own costly inefficiencies.
No Signal Where You Actually Work
Underground vaults, rural transmission corridors, and remote substations rarely have reliable mobile coverage. Cloud-dependent apps fail precisely where they're needed most, forcing technicians to take notes and hope they remember everything when they're back online. Data loss in these scenarios isn't just inconvenient—it can mean repeated site visits and safety risks.
There's a better way. →
How Geocadra Solves These Problems
Geocadra was built by people who understand utility fieldwork. Every feature addresses a real problem that costs your team time and money.
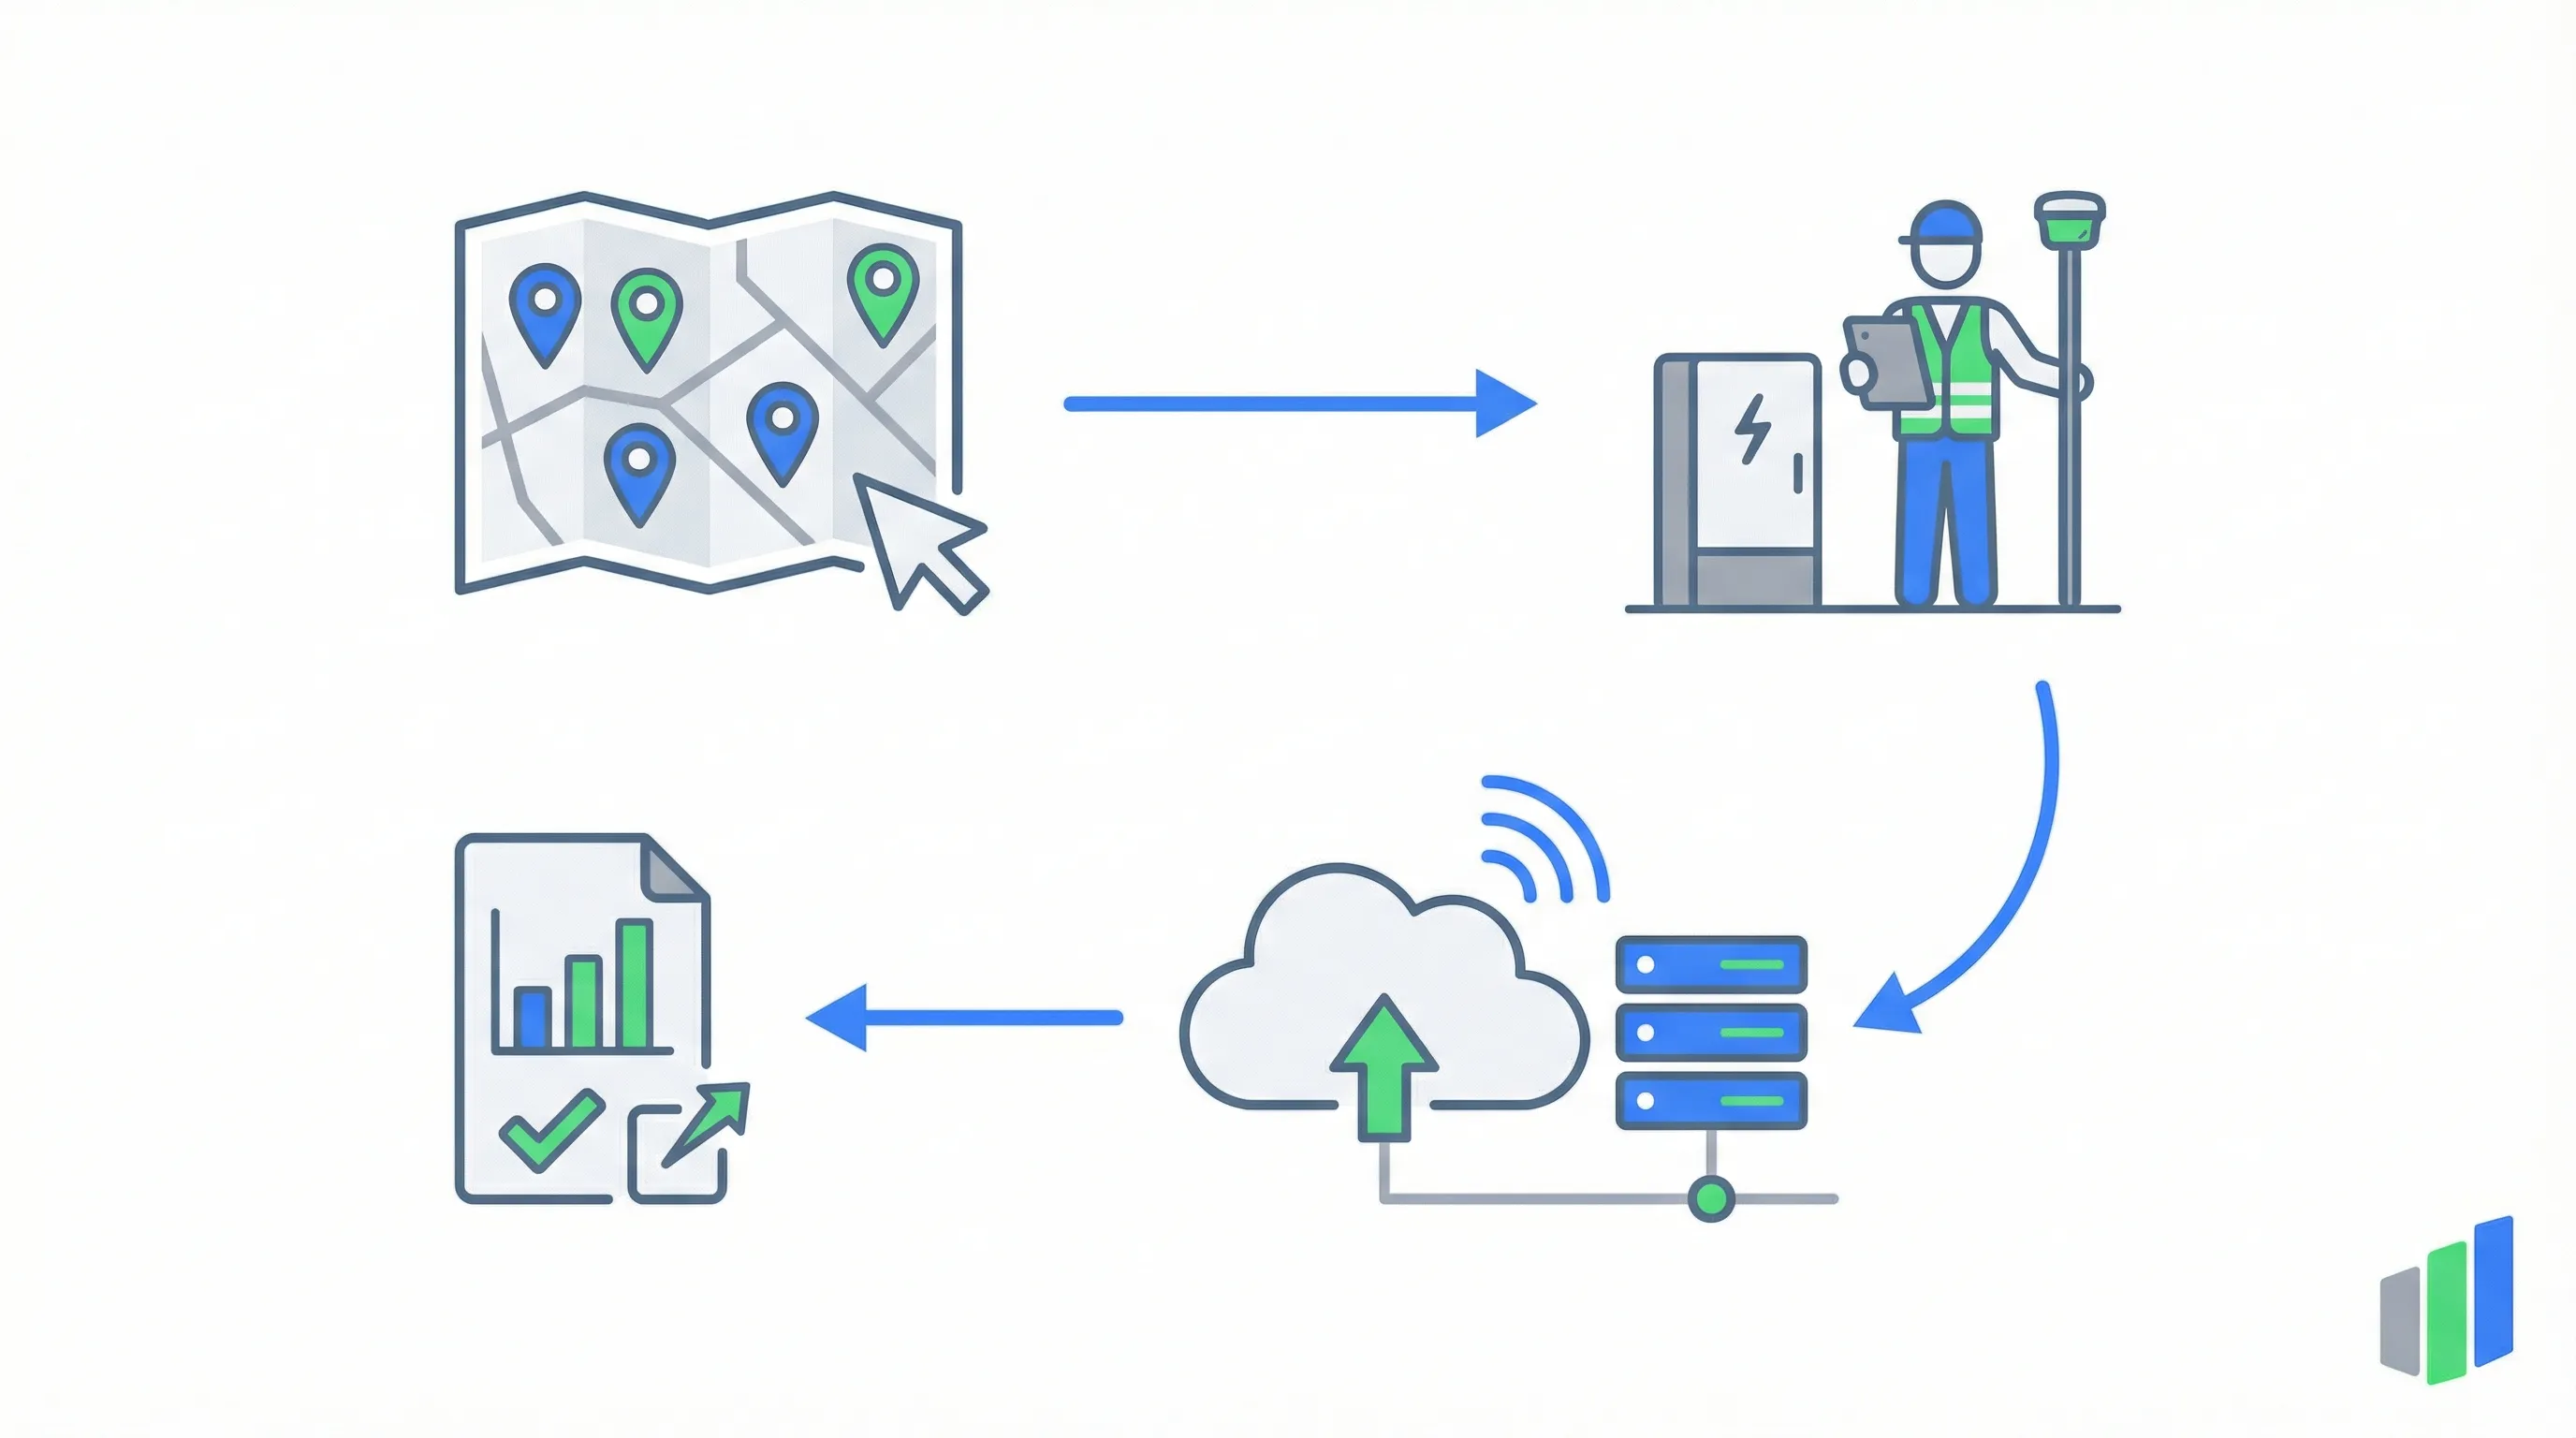
Data Flows Directly From Field to System
Capture inspection data once in the field, and it's immediately ready for export to your asset management system. No transcription, no re-entry, no errors from mistyped values. Our export formats integrate with Maximo, SAP PM, and standard GIS systems. What used to take 2-4 hours of office time now happens automatically.
Real-Time Crew Tracking and Area Assignments
See exactly where every technician is working and what they've completed. Assign specific poles, pipeline segments, or substations to individual crew members. When priorities change—an emergency repair, a regulatory deadline, weather closing in—you can reallocate resources instantly based on actual field positions, not guesswork.
Audit-Ready Documentation With Complete Chain of Custody
Every inspection record includes automatic timestamps, GPS coordinates, and user identification. Photos link directly to specific assets with embedded metadata. When auditors or regulators ask for documentation, you export exactly what they need in minutes rather than spending days compiling evidence from scattered sources.
Per-Organisation Pricing That Scales With Your Team
One price for your entire organisation—not per-user fees that punish you for adding technicians. Whether you have 5 field crew or 50, your costs remain predictable. This makes professional-grade inspection tools accessible to municipal utilities, contractors, and smaller operators who've been priced out of enterprise solutions.
Common Workflows
Here's exactly how utility field teams use Geocadra day-to-day for their most common inspection and survey tasks—from the moment they arrive on site to the final report export.
Pole and Tower Inspection
A complete end-to-end workflow for inspecting transmission and distribution poles, wooden towers, and steel lattice structures—from arrival at the asset to audit-ready documentation.
- Open the pole inspection template in Geocadra and scan or enter the existing pole ID. The map shows you all assigned poles for today, colour-coded by inspection status.
- Walk around the structure and capture geotagged photos of the base, mid-section, crossarms, and any attachments. Each photo automatically links to the pole record with GPS coordinates and timestamp.
- Complete the standardised condition rating form—covering foundation condition, wood decay or steel corrosion, hardware integrity, and clearance measurements. Dropdown menus enforce consistent terminology across your entire team.
- Flag any assets requiring immediate attention with severity ratings. When you sync, the data exports directly to your asset management system (Maximo, SAP PM, or GIS) with zero re-entry.
Pipeline Corridor Surveys
Walk or drive pipeline routes efficiently while capturing encroachment issues, vegetation concerns, and right-of-way conditions with a complete GPS-tracked record.
- Load the pipeline route into Geocadra's map view. The corridor displays as a highlighted path with marker posts and previously recorded observations visible for reference.
- Begin your survey—Geocadra records a continuous GPS track as you walk or drive the route. Tap to drop observation points wherever you spot encroachment, ground disturbance, exposed pipe, or third-party activity.
- At each observation point, fill out the corridor survey form: categorise the issue type, estimate severity, take photos from multiple angles, and add voice notes for detailed descriptions when typing isn't practical.
- On completion, export the full corridor survey as a GIS-ready dataset—GPS track, observation points, photos, and condition data—ready for import into your pipeline integrity management system.
Substation Equipment Audits
Systematically audit transformers, switchgear, circuit breakers, and control equipment using structured digital checklists that match your internal maintenance standards.
- Select the substation from your project map and open the equipment audit form. The checklist populates with all known equipment based on your imported asset register.
- Work through each piece of equipment systematically: photograph the nameplate for serial number and rating data, then complete condition assessments for insulation, connections, oil levels, earthing, and enclosure integrity.
- Record instrument readings directly in the form—partial discharge measurements, thermography observations, and oil analysis results all attach to the specific equipment record with automatic timestamps.
- Review the completed audit on-device before leaving site. Geocadra highlights any missed items or incomplete fields. Export the full audit report with all photos and readings for your maintenance planning system.
Gas Leak Detection Surveys
Record gas leak indications with precise GPS locations, severity classifications, and instrument readings for direct integration with your leak management and emergency response systems.
- Start a new leak detection survey route in Geocadra. The map displays the pipeline network, previous leak records, and your current GPS position in real-time.
- When your detection instrument indicates a leak, tap the map to record the precise GPS location. The form captures leak grade (1-3), reading values (ppm or %LEL), surface type, and environmental conditions.
- Photograph the leak location, surrounding infrastructure, and any visible indicators. Each photo auto-tags with coordinates and links to the leak record for evidence chain integrity.
- Export the completed survey directly to your gas leak management system. Priority leaks are flagged for immediate dispatch, while lower-grade leaks feed into planned repair schedules.
Vegetation Management Along Corridors
Survey and document vegetation encroachment along power line corridors and pipeline rights-of-way, producing prioritised trimming work orders with photo evidence.
- Load the corridor route and begin walking or driving the right-of-way. Geocadra shows the easement boundaries and minimum clearance zones on the map overlay.
- At each encroachment point, record species identification, estimated height, distance from conductors or pipeline, and growth rate assessment. Drop-down menus make species selection fast even for non-botanists.
- Capture photos showing the encroachment from multiple angles—close-up for species ID and wide-angle for context. Annotate photos with estimated clearance distances.
- Generate prioritised trimming work orders on export: each encroachment point includes location, photos, species, urgency rating, and estimated clearance work required—ready to hand to vegetation management contractors.
Smart Meter Rollout Documentation
Document every step of smart meter installations—from old meter removal through new meter commissioning—with the complete evidence trail that billing systems and regulators require.
- Arrive at the property and open the smart meter installation form. Photograph the existing meter, recording the final reading, serial number, and current installation configuration.
- Document the installation process: new meter serial number, communication module ID, connection type, CT ratios (for commercial meters), and any modifications to the meter board or service cable.
- Capture commissioning photos showing the completed installation, display reading, signal strength, and head-end connectivity confirmation. Record the customer's opening reading.
- Collect the customer signature on-device confirming the installation. The complete record—photos, readings, serial numbers, and signature—exports directly to your billing system and regulatory compliance database.
Measurable Results
Compliance & Standards
Geocadra's templates and documentation features help utility teams meet regulatory requirements efficiently.
ISO 55000
The international standard for asset management systems requires documented evidence of condition assessments, maintenance decisions, and lifecycle planning. Geocadra's forms capture all required condition data with automatic timestamps and GPS verification, creating the audit trail ISO 55000 demands.
ENTSO-E
European network codes for transmission system operators specify documentation requirements for grid assets. Geocadra exports inspection data in formats ready for regulatory submission, reducing compliance preparation time from days to hours.
LOLER
The Lifting Operations and Lifting Equipment Regulations require regular inspection of lifting equipment with documented evidence. Our pre-built checklists cover LOLER inspection requirements while automatic scheduling ensures nothing gets missed.
PUWER
The Provision and Use of Work Equipment Regulations require employers to ensure equipment is maintained in safe condition. Geocadra tracks equipment inspections, flags overdue assessments, and maintains the documentation trail that demonstrates compliance.
Frequently Asked Questions
Can Geocadra integrate with our existing asset management system?
Yes. Geocadra exports data in standard formats including Shapefile, GeoJSON, CSV, and Excel. These integrate directly with IBM Maximo, SAP PM, Oracle Utilities, and most GIS platforms. For deeper integration, our REST API allows automated data synchronisation with your existing systems.
How long does it take to train field technicians?
Most technicians are productive within an hour. The interface mirrors familiar mobile app patterns, so there's no complex GIS training required. We provide onboarding support and can configure your specific forms and workflows before deployment.
How is our utility data secured?
Data is encrypted both in transit and at rest. We're hosted on EU-based servers with GDPR compliance. Role-based access controls let you limit who sees what, and complete audit logs track all data access. We can also support on-premise deployment for organisations with strict data residency requirements.
Can we import our existing asset data?
Yes. We can import asset locations, IDs, and attributes from GIS files, spreadsheets, or database exports. This means your technicians see familiar asset identifiers in the field rather than starting from scratch.
Ready to transform your Utility Asset Management workflow?
Join teams who've already made the switch