The standard protocol for classifying lake and reservoir eutrophication using Secchi depth, chlorophyll-a, and total phosphorus.
The Carlson Trophic State Index (TSI) is the most widely adopted framework for quantifying the biological productivity and nutrient status of lakes, reservoirs, and ponds. Developed by Robert Carlson in 1977 and refined alongside the OECD Eutrophication Control programme, the index transforms three measurable parameters — Secchi disk transparency, chlorophyll-a concentration, and total phosphorus concentration — into a unified 0–100 numerical scale. This guide covers the three TSI equations, the OECD trophic classification thresholds, user perception survey methodology, field measurement protocols, and how to digitize the entire assessment workflow with Geocadra.
What is Carlson TSI?
The Carlson Trophic State Index (TSI) is the global standard for classifying the biological productivity of lakes and reservoirs. It uses three parameters — Secchi disk transparency, chlorophyll-a, and total phosphorus — to produce a numerical score from 0 to 100, classifying water bodies as Oligotrophic, Mesotrophic, Eutrophic, or Hypereutrophic.
- Full Name
- Trophic State Index (TSI)
- Issuing Body
- Carlson (1977) / NALMS / OECD
- Current Revision
- Carlson 1977, refined by NALMS protocols
How the Carlson TSI Assessment Works
The Carlson Trophic State Index provides a standardised, quantitative method for evaluating the eutrophication status of lentic water bodies. Unlike subjective visual assessments, the TSI converts three independently measurable water quality parameters into a single numerical scale from 0 (ultra-oligotrophic, crystal-clear, nutrient-depleted) to 100 (hypereutrophic, severe algal blooms, impaired recreation). The index was originally published by Robert Carlson in the journal Limnology and Oceanography in 1977 and has since been adopted by the North American Lake Management Society (NALMS), the OECD, and state environmental agencies worldwide as the primary metric for lake trophic classification.
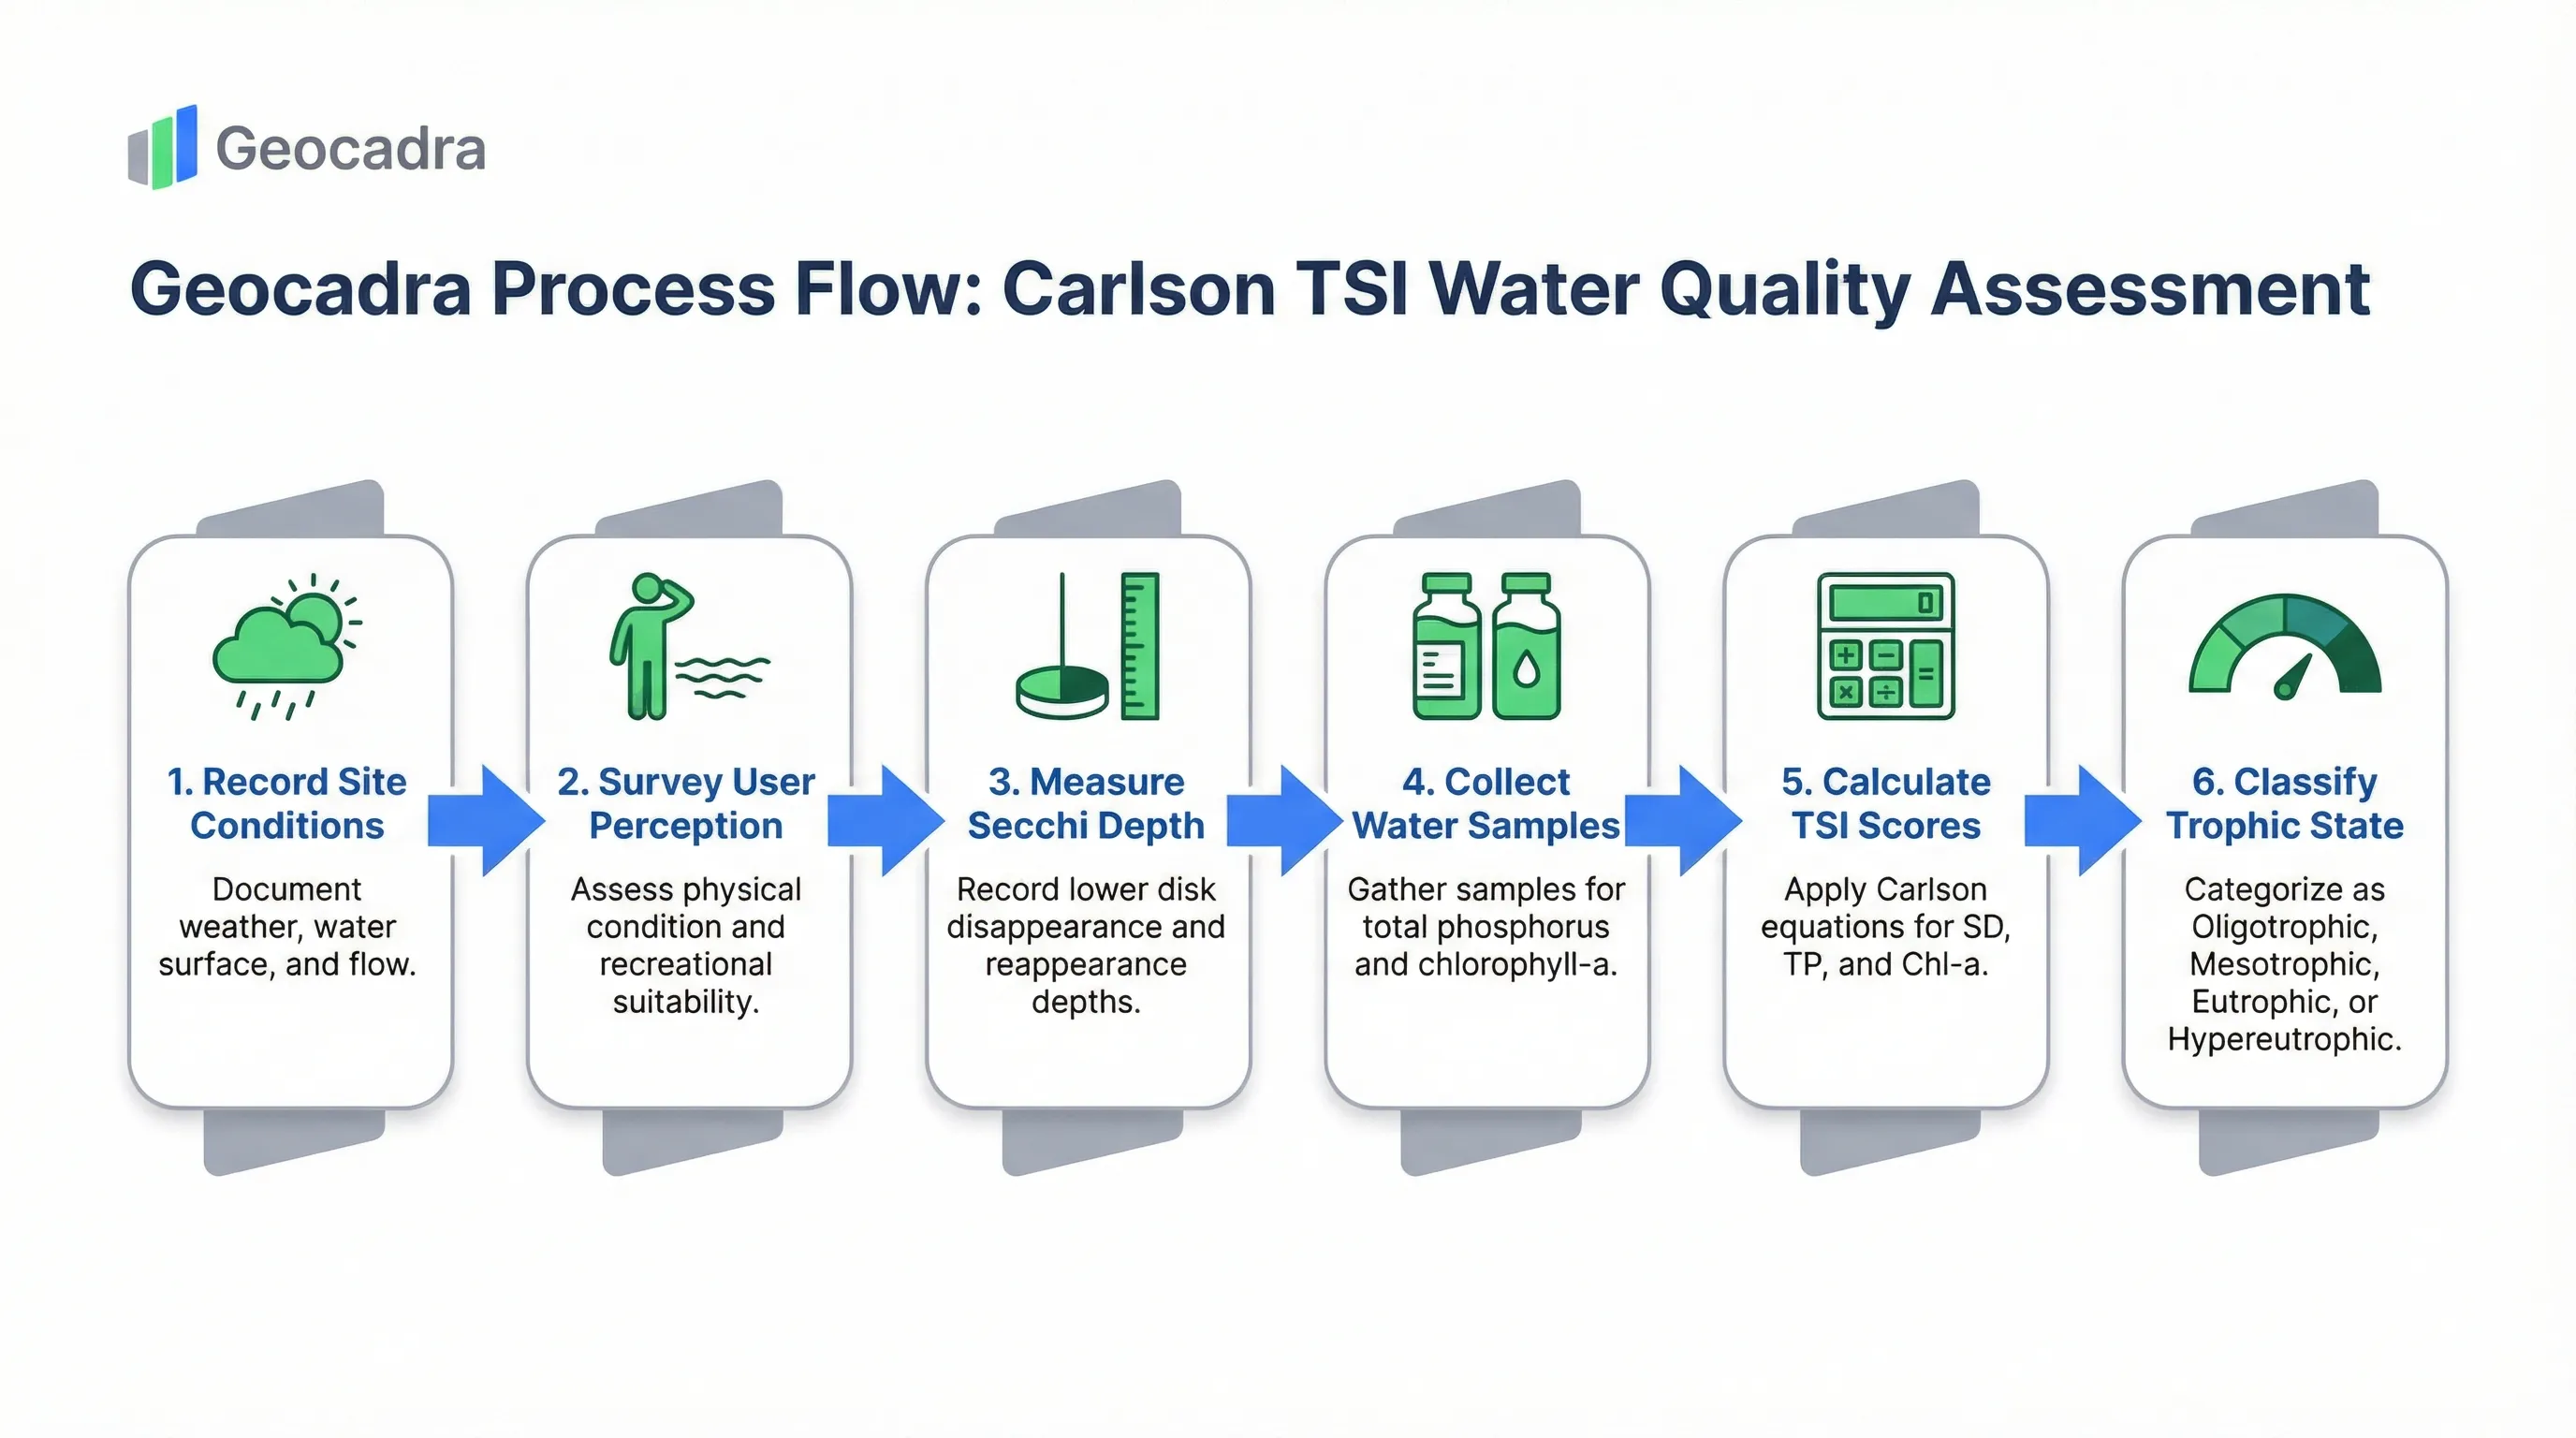
The assessment protocol follows a deliberate sequence designed to minimise bias and maximise data quality. The inspector first records environmental site conditions — cloud cover, wind speed, water surface state, and water colour — because these variables directly influence the accuracy of the subsequent Secchi disk reading. Next, the inspector completes the user perception surveys before taking any physical measurements, ensuring that the subjective ratings are not biased by knowledge of the actual transparency depth. Only then does the inspector deploy the Secchi disk and collect water samples for laboratory analysis of total phosphorus and chlorophyll-a.
The three resulting TSI values — TSI(SD), TSI(TP), and TSI(Chl) — are analysed both individually and as an ensemble. When all three indices agree, the trophic classification is straightforward. When they diverge, the pattern of divergence reveals important diagnostic information: for example, a TSI(Chl) substantially lower than TSI(TP) suggests phosphorus is present but not driving algal growth, possibly due to nitrogen limitation or zooplankton grazing. This diagnostic capability is what makes the Carlson TSI far more powerful than a single-parameter classification.
The index was originally published in 1977 in Limnology and Oceanography and is maintained globally by the North American Lake Management Society (NALMS) as the primary methodology for lake trophic classification.
The Three Carlson TSI Equations
Each TSI parameter has its own logarithmic equation that maps the raw measurement onto the 0–100 index scale. The equations are calibrated so that identical trophic conditions produce identical TSI values across all three parameters.
The Carlson TSI system uses three separate natural-logarithm-based equations, each derived from the empirical relationship between its parameter and overall lake productivity. The equations are mathematically linked so that a TSI value of 40 corresponds to the oligotrophic–mesotrophic boundary and a TSI of 50 corresponds to the mesotrophic–eutrophic boundary for all three parameters simultaneously. This alignment means that when a lake is behaving according to the classical phosphorus–chlorophyll–transparency cascade, all three TSI values will be within a few points of each other.
TSI(SD) — Secchi Disk Transparency
TSI(SD) = 60 − 14.41 × ln(Secchi depth in metres). This is the field-deployable index: Secchi depth is measured by averaging the disappearance and reappearance depths of a standard 20 cm black-and-white disk. A Secchi depth of 1 metre yields a TSI(SD) of 60, while 4 metres yields approximately 40. The Secchi reading is limited to photic-zone depth — if the disk hits the lake bottom, the TSI(SD) cannot be calculated because transparency was not fully constrained by algal or particulate scattering.
TSI(Chl) — Chlorophyll-a
TSI(Chl) = 9.81 × ln(chlorophyll-a in µg/L) + 30.6. Chlorophyll-a is the most direct surrogate for algal biomass because it is the primary photosynthetic pigment present in all phytoplankton species. A chlorophyll-a concentration of 2.6 µg/L corresponds to a TSI of approximately 40 (oligotrophic–mesotrophic boundary), while 7.2 µg/L corresponds to approximately 50 (mesotrophic–eutrophic boundary). Samples are typically collected using an integrated hose sampler from the upper two metres of the water column.
TSI(TP) — Total Phosphorus
TSI(TP) = 14.42 × ln(total phosphorus in µg/L) + 4.15. Total phosphorus is the nutrient driver of eutrophication in most freshwater systems. A TP concentration of 12 µg/L marks the oligotrophic–mesotrophic threshold (TSI ≈ 40), while 24 µg/L marks the mesotrophic–eutrophic threshold (TSI ≈ 50). In the digital form, TP values are either entered from a field probe reading or populated later via laboratory analysis after sample bottles — identified by their Sample ID barcodes — are processed.
OECD / Carlson Trophic State Classification
The calculated TSI score maps directly onto one of four trophic state categories defined by the OECD eutrophication control framework.
The Carlson TSI scale divides the 0–100 range into four discrete trophic state categories that describe the biological productivity and overall ecological health of a lake. Each category has corresponding reference ranges for total phosphorus, chlorophyll-a, and Secchi depth, providing a multi-parameter cross-check on the classification. The categories are universally recognised in limnology and environmental regulation, making them the common language for communicating lake health to regulators, the public, and watershed managers.
Critically, the trophic state classification is not inherently a "good or bad" judgement. A naturally eutrophic lake (for example, a shallow prairie pothole lake with naturally high phosphorus soils) is not degraded — its high TSI reflects its natural condition. The classification becomes a management concern when a lake is transitioning to a higher trophic state due to anthropogenic nutrient loading, a process known as cultural eutrophication. The TSI time-series data collected through repeated assessments is therefore the primary tool for detecting whether a water body is stable, improving, or degrading over time.
| Trophic State | TSI Range | TP (µg/L) | Chl-a (µg/L) | Secchi (m) | Description |
|---|---|---|---|---|---|
| Oligotrophic | < 40 | < 12 | < 2.6 | > 4.0 | Clear water, oxygen-rich throughout, low biological productivity, excellent recreational quality. |
| Mesotrophic | 40 – 50 | 12 – 24 | 2.6 – 7.2 | 2.0 – 4.0 | Moderate clarity, potential for hypolimnetic anoxia in summer, increasing weed growth. |
| Eutrophic | 50 – 70 | 24 – 96 | 7.3 – 56 | 0.5 – 2.0 | Nutrient-rich, algae dominant, macrophyte problems, warm-water fishery, impaired recreation. |
| Hypereutrophic | > 70 | > 96 | > 56 | < 0.5 | Heavy algal blooms, dense scum, frequent fish kills, unusable for recreation or drinking supply. |
Boundary values are approximate. Actual TSI scores are continuous; trophic state boundaries represent transitions, not hard thresholds.
Related wastewater systems that impact receiving water quality are assessed with the EN 13508-2 sewer inspection standard.
Try this Carlson TSI form in Geocadra
We have a pre-built Carlson TSI inspection template ready to go. Sign up and start your first condition assessment today.
Free 14-day trial. No credit card required.
User Perception Surveys: Linking TSI to Human Use
The Carlson TSI protocol includes standardised 1–5 rating scales that correlate measured water quality with actual recreational impairment experienced by lake users.
One of the most distinctive aspects of the Carlson TSI assessment protocol is the integration of subjective user perception surveys alongside objective physical and chemical measurements. Developed by NALMS and refined through the Citizens Statewide Lake Assessment Program (CSLAP) in New York and the Minnesota Pollution Control Agency (MPCA), these two five-point rating scales quantify the human experience of water quality in a standardised, repeatable way. The perception surveys are deliberately completed before the inspector takes the Secchi reading to prevent measurement bias — knowing the exact Secchi depth would anchor the inspector's subjective rating.
The Physical Condition Rating asks the inspector to rate the water body on a 1–5 scale from "Crystal clear water" (1) through "Definite algae greenness/yellowness" (3) to "Severely high algae levels, scum, odour" (5). The Recreational Suitability Rating uses the same 1–5 range from "Beautiful, could not be nicer" (1) through "Swimming/enjoyment slightly impaired" (3) to "Swimming impossible" (5). These two ratings are strongly correlated with TSI values: lakes with TSI below 40 almost always receive perception ratings of 1 or 2, while lakes with TSI above 60 consistently receive ratings of 4 or 5.
The form also captures Negative Factors through a multi-select field where the inspector identifies specific impairments such as algae, weeds/macrophytes, debris/litter, murkiness from silt or clay, odour, or foam. This field is diagnostically valuable because it disambiguates the driver of the perception rating — a lake rated 4 due to heavy macrophyte growth presents a different management challenge than a lake rated 4 due to algal scum. In the digital form, these three fields — Physical Condition, Recreational Suitability, and Negative Factors — are grouped in the Perception & Observations section, sequenced before the measurement fields.
| Rating | Physical Condition | Recreational Suitability |
|---|---|---|
| 1 | Crystal clear water | Beautiful, could not be nicer |
| 2 | Not quite crystal clear, a little algae | Very minor aesthetic problems |
| 3 | Definite algae greenness/yellowness | Swimming/enjoyment slightly impaired |
| 4 | High algae levels, limited clarity | Desire to swim substantially reduced |
| 5 | Severely high algae, scum, odour | Swimming impossible |
Surveys must be completed before the Secchi disk reading to prevent measurement bias. Scales developed by NALMS/CSLAP/MPCA protocols.
Secchi Disk and Water Sampling Protocol
The core physical measurements for the Carlson TSI require specific equipment, sampling methods, and validation rules to ensure calculation accuracy.
The Secchi disk measurement is the primary field-deployable component of the Carlson TSI. The standard protocol uses a 20 cm diameter disk divided into alternating black and white quadrants, lowered on a calibrated line from the shaded side of the boat. The inspector records the depth at which the disk disappears while being lowered (Disappearance Depth) and the depth at which it reappears while being raised (Reappearance Depth). The Secchi depth used in the TSI(SD) equation is the arithmetic mean of these two readings. In the digital form, both fields are required numeric inputs with two-decimal precision, and the average is auto-calculated.
A critical validation rule in the form is the "Hit Bottom?" boolean field. If the Secchi disk reaches the lake bottom before disappearing, the reading is invalid for TSI calculation because the light extinction was not fully constrained by water column turbidity. The form flags this condition and excludes the reading from the TSI(SD) calculation. The inspector also records the Disk Type (Standard 20cm Black/White or Marine 30cm White) and whether a Viewscope was used to eliminate surface glare, both of which affect data comparability across monitoring programmes.
Water sample collection for the chemical TSI parameters follows the same site visit. The form captures the Sample Collection Method — Integrated Hose (0–2 m), Van Dorn (discrete depth), or Surface Grab — with integrated hose sampling being the standard for Carlson TSI because it produces a representative composite of the epilimnion. Sample Depth is recorded in metres (typically 2.0 m or twice the Secchi depth). Each sample bottle receives a unique Sample ID (Total Phosphorus ID and Chlorophyll-a ID) for laboratory chain-of-custody tracking. The TP and Chl-a concentration values may be entered immediately if field probes are used, or populated later when laboratory results return via API integration.
For assessing sustainable drainage systems that discharge into lakes and reservoirs, see the CIRIA C753 SuDS inspection standard. Browse all available inspection standards in the standards directory.
Frequently Asked Questions
What is the Carlson Trophic State Index (TSI)?
The Carlson TSI is the standard method for quantifying the biological productivity of lakes and reservoirs. It uses three parameters — Secchi disk transparency, chlorophyll-a concentration, and total phosphorus concentration — to calculate a numerical score from 0 to 100 that classifies water bodies into trophic states from Oligotrophic (clear, nutrient-poor) to Hypereutrophic (dense algal blooms).
How is the Carlson TSI score calculated?
Three separate logarithmic equations are applied: TSI(SD) = 60 − 14.41 × ln(Secchi metres), TSI(Chl) = 9.81 × ln(Chl-a µg/L) + 30.6, and TSI(TP) = 14.42 × ln(TP µg/L) + 4.15. Each produces an independent index value on the 0–100 scale. The three values are compared to classify the trophic state and diagnose nutrient–algae dynamics.
What is the difference between TSI(SD), TSI(Chl), and TSI(TP)?
TSI(SD) measures water clarity using a Secchi disk, TSI(Chl) measures algal biomass via chlorophyll-a pigment, and TSI(TP) measures the nutrient driving eutrophication. When all three agree, the classification is straightforward. When they diverge, the pattern reveals causes such as non-algal turbidity, nitrogen limitation, or zooplankton grazing.
What happens if the Secchi disk hits the lake bottom?
If the Secchi disk reaches the bottom before disappearing, the TSI(SD) cannot be calculated because water transparency was not fully limited by algal or particulate scattering. The form flags this reading as invalid. The inspector can still classify the lake using TSI(Chl) and TSI(TP) from the water samples collected during the same visit.
Why are user perception surveys completed before the Secchi measurement?
The NALMS/CSLAP protocol requires perception ratings before physical measurements to prevent anchoring bias. If the inspector knew the Secchi depth was, for example, 1.2 metres, that knowledge would influence their subjective rating of water clarity and recreational suitability. Recording perceptions first ensures genuinely independent subjective and objective data.
How often should Carlson TSI assessments be performed?
Most lake monitoring programmes conduct TSI assessments biweekly or monthly during the growing season (May–September in the Northern Hemisphere). A minimum of four to six sampling events per season provides a reliable seasonal average. Year-round monthly sampling is recommended for lakes with winter algal bloom potential or subtropical climates.
Can the Carlson TSI be applied to rivers or streams?
The Carlson TSI was designed specifically for lentic (still) water bodies — lakes, reservoirs, and ponds. It is not appropriate for lotic (flowing) systems because Secchi depth, chlorophyll-a, and phosphorus behave differently in moving water. River and stream eutrophication assessments use different indices such as periphyton-based metrics.
Digitize your Carlson TSI inspections
Replace paper forms and spreadsheets with structured digital inspections — built for standards like Carlson TSI.
Free 14-day trial. No credit card required.