The UK standard for assessing cycling infrastructure quality using 25 scored indicators across five design principles.
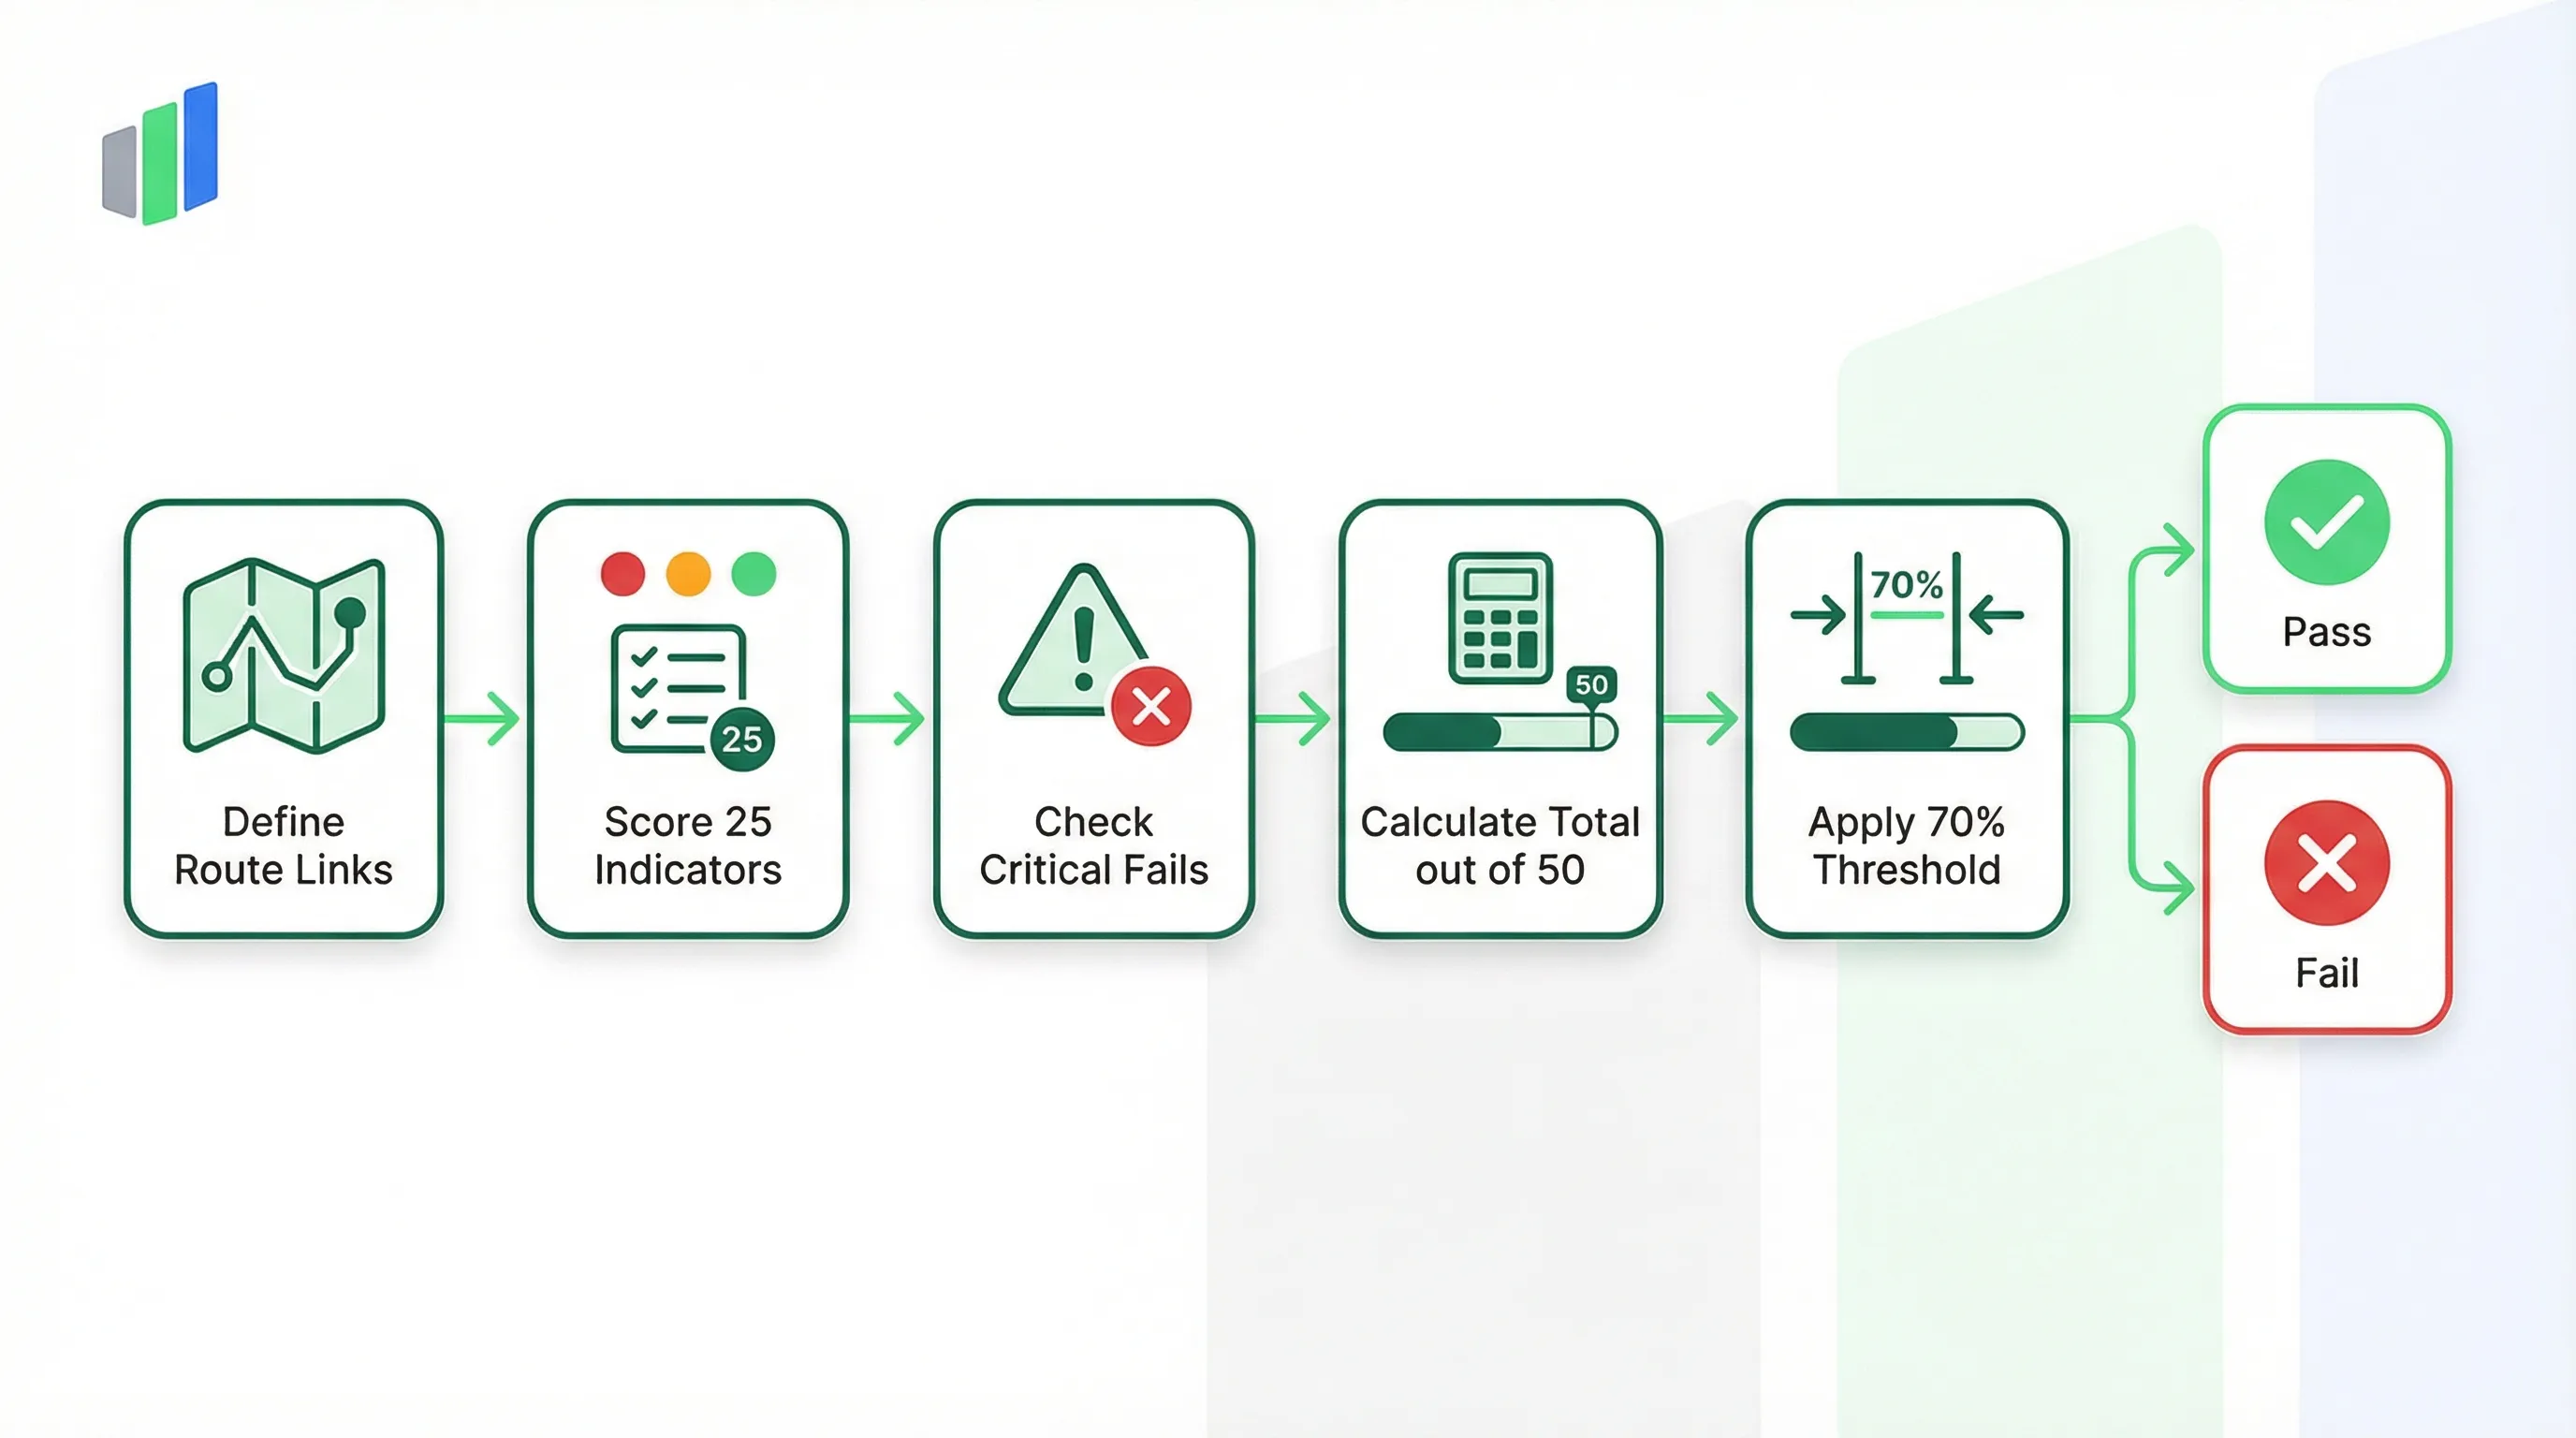
Local Transport Note 1/20 (LTN 1/20) is the definitive national design standard for cycling infrastructure in England. Its Appendix A Cycling Level of Service (CLoS) tool provides a structured 25-indicator assessment that scores routes on five core design principles: Cohesion, Directness, Safety, Comfort, and Attractiveness. Each indicator is rated 0 (Red), 1 (Amber), or 2 (Green), producing a total score out of 50 points. Schemes must achieve at least 70% (35 points) and avoid all Critical Fail conditions to be considered for government funding.
What is LTN 1/20?
LTN 1/20 (Local Transport Note 1/20) is the UK national design standard for cycling infrastructure. Its Cycling Level of Service (CLoS) tool in Appendix A uses 25 indicators scored Red (0), Amber (1), or Green (2) across five principles — Cohesion, Directness, Safety, Comfort, and Attractiveness — with a 70% pass threshold and Critical Fail overrides for funding eligibility.
- Full Name
- Local Transport Note 1/20 — Cycle Infrastructure Design
- Issuing Body
- Department for Transport (DfT), United Kingdom
- Current Revision
- LTN 1/20 (July 2020)
The Red/Amber/Green Traffic Light Scoring System
LTN 1/20 CLoS uses a strict three-level traffic light system across all 25 indicators. Each score maps directly to a quality threshold that determines whether cycling infrastructure meets the inclusive "8-to-80" design philosophy.
The Cycling Level of Service tool assigns every indicator one of three scores: 2 (Green) for high quality or best practice, 1 (Amber) for minimum acceptable standard, and 0 (Red) for critical or unacceptable conditions. This traffic light approach was deliberately chosen to make assessments immediately legible to non-specialist audiences, including councillors, planning officers, and community stakeholders. A Green score of 2 represents infrastructure that meets the full recommended standards found in LTN 1/20 and is safe for all abilities, including children aged 8 and adults aged 80. Examples include fully separated cycle tracks, traffic speeds below 20 mph, smooth machine-laid asphalt surfaces, and well-lit routes throughout. The design philosophy behind the Green threshold is that cycling should require no more skill or courage than walking.
An Amber score of 1 indicates the minimum acceptable standard. The infrastructure meets basic requirements but may have minor issues or require higher cyclist skill and confidence. Examples include light segregation with wands or planters, some delay at signalised junctions, hand-laid surfaces with minor joints, and routes with infrequent unlit sections. Amber scores are tolerable in small numbers but an accumulation of Amber ratings across multiple indicators signals that the route, while not critically dangerous, falls short of inclusive design and may deter less confident riders. A Red score of 0 represents conditions that are critical or unacceptable and do not meet basic safety or quality requirements. Examples include sharing traffic lanes with vehicles travelling above 37 mph, cycle lanes in the dangerous 3.2-to-3.9-metre "murder strip" range, routes with disconnected sections requiring dismounting, and significant kerbside conflict zones adjacent to parking. Several Red scores carry the additional penalty of being designated Critical Fail conditions, which override the total percentage score entirely.
The total assessment score is calculated by summing all 25 indicator scores, producing a result between 0 and 50 points. The percentage is derived by dividing the total by 50 and multiplying by 100. To pass the CLoS assessment, a scheme must achieve at least 70% (35 out of 50 points) and must not trigger any Critical Fail condition. A route scoring 45 out of 50 (90%) still fails if it scores Red on Junction Speed (Criterion 9) because that specific indicator carries a Critical Fail designation. This dual-gate mechanism ensures that schemes cannot compensate for genuinely dangerous conditions by accumulating high scores on less safety-critical indicators like signing or street clutter.
| Score | Label | Colour | Definition |
|---|---|---|---|
| 2 | Green | High Quality | Meets recommended LTN 1/20 standards. Safe for all abilities (ages 8 to 80). Fully separated, low speed, no defects. |
| 1 | Amber | Minimum Acceptable | Meets basic requirements with minor issues. May require higher cyclist skill. Light segregation, some junction delay. |
| 0 | Red | Critical / Unacceptable | Does not meet basic safety or quality requirements. Often triggers Critical Fail. Shared high-speed lanes, murder strips, disconnected routes. |
Total score = sum of all 25 indicators (max 50). Pass threshold: 70% (35 points) with zero Critical Fails. A single Critical Fail overrides the total score.
The official LTN 1/20 documentation is published by the Department for Transport (DfT) and defines the national design standards for all cycling infrastructure in England.
The 25 Indicators Across Cohesion, Directness, Safety, Comfort, and Attractiveness
LTN 1/20 organises its 25 CLoS indicators under five core design principles. Each principle targets a different dimension of the cycling experience, and together they define what "good" cycling infrastructure looks like from both a safety engineering and user experience perspective.
Cohesion (Indicators 1-3)
Cohesion (Indicators 1-3) evaluates how well the cycling route connects to the wider network. Indicator 1 (Connections) assesses whether dedicated connections are provided between route sections, scoring Green when cyclists can transition seamlessly between routes and Red when they must dismount and walk. Indicator 2 (Continuity) checks whether the route is continuous through junctions and intersections, or whether cyclists are "abandoned" at transitions with no clear indication of where the route continues. Indicator 3 (Mesh Density) measures the density of the cycling network itself: Green requires a network mesh width below 250 metres, meaning parallel cycling routes are never more than 250 metres apart, while Red indicates mesh widths exceeding 1,000 metres with large gaps in network coverage. The Cohesion principle reflects LTN 1/20's emphasis that cycling infrastructure must form a connected network, not isolated fragments. A perfectly designed cycle track is of limited value if it does not connect to other routes, destinations, or transport interchanges.
Directness (Indicators 4-8)
Directness (Indicators 4-8) measures whether the cycling route offers a journey that is competitive with motor traffic in terms of distance and time. Indicator 4 (Deviation) compares the cycle route length to the direct motor vehicle route: a deviation factor below 1.2 scores Green, while a factor above 1.4 scores Red and triggers a Critical Fail because excessive detours undermine the fundamental viability of cycling as a transport mode. Indicator 5 (Stop Frequency) counts forced stops per kilometre, with fewer than 2 stops scoring Green and more than 4 scoring Red. Indicator 6 (Junction Delay) assesses whether cyclists experience less delay, similar delay, or greater delay than motor vehicles at signalised junctions. Indicator 7 (Link Speed) evaluates whether the cyclist can always choose an appropriate speed on the link, or is forced to travel at the speed of the slowest vehicle ahead in a shared lane. Indicator 8 (Gradient) checks the route profile against the recommendations in Figure 4.4 of LTN 1/20, with gradients below 2% throughout scoring Green and anything steeper than the recommended maxima scoring Red. In the form, the inspector records the deviation factor calculation and stop counts for each assessed link, creating an objective record of directness performance.
Safety (Indicators 9-16)
Safety (Indicators 9-16) is the most critical section, containing the majority of Critical Fail triggers. Indicator 9 (Junction Speed) measures the 85th percentile speed of motor traffic at junctions, scoring Green below 30 mph and triggering a Critical Fail at Red when speeds exceed 37 mph (60 km/h). Indicator 10 (Link Speed) applies the same speed thresholds to shared road links between junctions. Indicator 11 (Traffic Volume) uses Annual Average Daily Traffic (AADT) thresholds: below 5,000 AADT with low HGV percentages scores Green, while exceeding 10,000 AADT or 5% HGV composition triggers a Critical Fail. Indicator 12 (Segregation) is where the infamous "murder strip" rule applies: a nearside lane width between 3.2 and 3.9 metres scores Red with a Critical Fail because this width is too narrow for safe overtaking but too wide for motor vehicles to wait behind a cyclist, encouraging dangerous close passes. Indicator 13 (Junction Conflict) evaluates how side road and major junction conflicts are managed, with untreated frequent side roads triggering a Critical Fail. Indicator 14 (Road Markings) assesses marking clarity. Indicator 15 (Kerbside Activity) checks for conflict between the cycle lane and parking or loading activity, with a lane under 2 metres adjacent to parking scoring Red for Critical Fail due to dooring risk. Indicator 16 (Evasion Room) evaluates whether cyclists have escape space when encountering hazards.
Comfort (Indicators 17-19)
Comfort (Indicators 17-19) addresses the physical ride quality. Indicator 17 (Surface Defects) differentiates between smooth, high-grip surfaces (Green), minor or occasional defects (Amber), and numerous minor or any major defects like potholes or root heave (Red). Indicator 18 (Surface Type) scores machine-laid asphalt or smooth non-slip surfaces as Green, hand-laid materials or paviours with joints as Amber, and bumpy, unbound, or slippery surfaces as Red. Indicator 19 (Effective Width) is potentially a Critical Fail: Green requires recommended widths maintained throughout, while Red is triggered when more than 25% of the route falls below 75% of the desirable minimum width. For a one-way cycle track, the desirable minimum is 2.0 metres, so Red means more than a quarter of the route is narrower than 1.5 metres. Width pinch points are a leading cause of cyclist discomfort and collision with pedestrians on shared-use paths, making this indicator especially important for accessibility compliance.
Attractiveness (Indicators 20-25)
Attractiveness (Indicators 20-25) evaluates the broader environment and social safety of the route. Indicator 20 (Signing) checks wayfinding quality at decision points. Indicator 21 (Lighting) scores routes lit to highway standards as Green and mostly unlit routes as Red. Indicator 22 (Isolation) assesses whether the route is overlooked by nearby activity (shops, housing, pedestrians) or runs through isolated, unobserved corridors — a key factor for personal safety, particularly for women and vulnerable users. Indicator 23 (Pedestrian Impact) evaluates whether the cycle route enhances, maintains, or degrades pedestrian provision, referencing the Pedestrian Comfort Level (PCL) framework. Indicator 24 (Street Clutter) checks whether excessive signage and street furniture make the route confusing or hazardous. Indicator 25 (Cycle Parking) assesses whether secure, sufficient cycle parking is available at destinations. While Attractiveness indicators rarely carry Critical Fail designations, they strongly influence whether people choose to cycle in the first place. Research consistently shows that perceived safety and route pleasantness are stronger determinants of cycling uptake than objective collision risk.
The surface quality indicators (Criteria 17-18) closely relate to methodologies in the UKPMS CVI road condition survey, which can provide more detailed pavement condition data for cycling routes.
Try this LTN 1/20 form in Geocadra
We have a pre-built LTN 1/20 inspection template ready to go. Sign up and start your first condition assessment today.
Free 14-day trial. No credit card required.
How Critical Fail Overrides the Total Score
The Critical Fail mechanism is the defining enforcement feature of LTN 1/20 CLoS. It prevents schemes from passing the assessment by compensating for genuinely dangerous conditions with high scores in non-safety indicators.
Under LTN 1/20, certain indicators are designated as Critical Fail conditions. When any of these indicators receives a Red score (0 points), the entire scheme is classified as "FAIL (Critical)" regardless of the overall percentage score. A route could achieve 45 out of 50 points — a 90% score that would comfortably exceed the 70% threshold — but if it scores Red on a single Critical Fail indicator, the scheme is ineligible for Active Travel Fund or similar government funding. This mechanism exists because the consequences of certain design failures are so severe that no amount of good design elsewhere can compensate for them. Forcing cyclists to share traffic lanes at speeds exceeding 37 mph, for example, creates a lethal collision risk that cannot be offset by excellent signing, smooth surfaces, or abundant cycle parking.
The Critical Fail indicators include: Criterion 4 (Deviation) where the cycle route is more than 1.4 times longer than the direct motor traffic alternative, making cycling uncompetitive; Criteria 9 and 10 (Junction Speed and Link Speed) where 85th percentile motor traffic speeds exceed 37 mph (60 km/h) in shared or adjacent conditions; Criterion 11 (Traffic Volume) where AADT exceeds 10,000 vehicles or HGV composition exceeds 5% without adequate segregation; Criterion 12 (Segregation) where the nearside lane falls within the 3.2-to-3.9-metre "murder strip" range that prevents safe overtaking; Criterion 13 (Junction Conflict) where frequent side roads or major junction movements are untreated; Criterion 15 (Kerbside Activity) where the cycle lane is under 2 metres wide adjacent to parking, creating a dooring zone; and Criterion 19 (Effective Width) where more than 25% of the route is significantly below the minimum desirable width. In the digital form, selecting a Red score on any Critical Fail indicator triggers an immediate warning: "CRITICAL FAIL DETECTED: Scheme is ineligible for funding." The inspector cannot override this warning — it is a hard-coded validation rule.
| Criterion | Indicator | Critical Fail Condition |
|---|---|---|
| 4 | Deviation (Detour) | Route deviation factor exceeds 1.4 compared to direct motor traffic alternative. |
| 9 | Junction Speed | 85th percentile motor traffic speed exceeds 37 mph (60 km/h) at junctions. |
| 10 | Link Speed (Shared) | 85th percentile motor traffic speed exceeds 37 mph (60 km/h) on shared links. |
| 11 | Traffic Volume | AADT exceeds 10,000 vehicles per day or HGV composition exceeds 5%. |
| 12 | Segregation (Passing) | Nearside lane width 3.2-3.9 m (the "murder strip") preventing safe overtaking. |
| 13 | Junction Conflict | Frequent untreated side roads or unseparated major junction movements. |
| 15 | Kerbside Activity | Cycle lane under 2 m wide adjacent to parking (dooring zone risk). |
| 19 | Effective Width | More than 25% of route below 75% of desirable minimum width. |
A single Critical Fail renders the scheme ineligible for funding regardless of total score. The assessment result is "FAIL (Critical)" even at 90%+ overall.
Many local authorities publish guidance on applying LTN 1/20. For Essex-specific guidance, see the Essex Active Travel Design Portal. For a broader overview of how local authorities apply the CLoS tool, see standards directory.
How to Conduct an LTN 1/20 CLoS Route Assessment
The CLoS assessment follows a link-based methodology. Routes are divided into homogeneous sections and each section is scored independently against all 25 indicators.
An LTN 1/20 CLoS assessment begins by dividing the route into homogeneous links — sections where the road characteristics remain broadly consistent. A link might be a 300-metre stretch of off-carriageway cycle track between two junctions, or a 500-metre segment of mixed traffic on a residential street. When the infrastructure type changes (for example, from a stepped cycle track to an advisory cycle lane), a new link begins. Each link is scored independently against all 25 indicators. The inspector first records the Route Context for each link: the infrastructure type (from eight options ranging from off-carriageway track to mixed traffic on a busy road), the posted speed limit, the 85th percentile measured or estimated speed, and the AADT motor traffic volume. These contextual fields drive several indicator scores — for example, the speed limit and AADT directly inform Criteria 9, 10, and 11.
The inspector then works through the 25 indicators in order, assigning Red, Amber, or Green to each based on the field conditions observed and any measurements taken. For width-related indicators (Criteria 12 and 19), multiple spot measurements may be needed along the link to determine compliance. For speed indicators (Criteria 9 and 10), the 85th percentile speed may be measured with a radar gun or estimated from traffic count data. Defects observed during the assessment — potholes, width pinch points, signing gaps, safety hazards — are logged in the repeatable Defects & Photos section with evidence photographs. Each defect is classified by type (Surface Defect, Width/Pinch Point, Signing/Lighting Issue, or Safety Hazard/Critical Fail) and documented with mandatory photo evidence and optional notes. The system then automatically calculates the Total Score (sum of all 25 indicators, maximum 50), the Percentage ((Total/50) x 100), the Critical Fail Count (number of Critical Fail indicators scored Red), and the Overall Result: "PASS" if the percentage is 70% or higher and the Critical Fail count is zero, "FAIL (Score)" if below 70% with no critical fails, or "FAIL (Critical)" if any Critical Fail indicator is Red.
For design verification of proposed schemes, the assessment can be conducted on paper using design drawings and traffic modelling data rather than field observation. The same 25 indicators apply, but the evidence comes from design specifications rather than site measurements. This dual-use capability — field audit and design verification — makes the CLoS tool both a retrospective quality audit and a prospective design gate. Local authorities across England use CLoS scores as a binding requirement for Active Travel Fund applications, and many authorities have adopted the tool for all cycling infrastructure regardless of funding source. The assessment is typically performed by transport planners, highway engineers, or cycling officers with training in LTN 1/20 methodology.
Digitize LTN 1/20 CLoS Assessments with Geocadra
LTN 1/20 CLoS assessments require scoring 25 indicators per link with automatic pass/fail logic, Critical Fail detection, and photographic evidence. Geocadra replaces paper-based CLoS worksheets with a structured digital form that enforces validation rules and calculates results in real time.
Traffic light indicator scoring
All 25 indicators are presented as structured Red/Amber/Green dropdowns with descriptive labels matching the official LTN 1/20 Appendix A wording. The inspector selects the appropriate score for each indicator, and the form automatically sums the total, calculates the percentage, and displays the overall pass/fail status.
Automatic Critical Fail detection
When a Red score is selected on any Critical Fail indicator (Criteria 4, 9, 10, 11, 12, 13, 15, or 19), the form immediately flags the assessment as "FAIL (Critical)" with a warning banner. This hard-coded validation ensures that Critical Fail logic cannot be overlooked or manually overridden.
Repeatable defect and photo logging
The Defects & Photos section supports unlimited repeatable entries. Each defect is classified by type — Surface Defect, Width/Pinch Point, Signing/Lighting Issue, or Safety Hazard — with mandatory geotagged photographs and optional notes. This creates a location-specific evidence trail for every issue identified during the assessment.
Multi-link route management
Routes with multiple homogeneous links can be assessed as separate form submissions, each with its own 25-indicator score sheet. The route context fields (infrastructure type, speed limit, AADT) reset for each link, ensuring that different sections with different characteristics receive independent scores rather than a blended average.
Frequently Asked Questions
What is the LTN 1/20 Cycling Level of Service (CLoS) tool?
The CLoS tool is the assessment methodology in Appendix A of Local Transport Note 1/20, the UK national cycling infrastructure design standard. It scores cycling routes on 25 indicators using a Red (0), Amber (1), Green (2) system across five design principles: Cohesion, Directness, Safety, Comfort, and Attractiveness.
What score is needed to pass an LTN 1/20 CLoS assessment?
A scheme must achieve at least 70% (35 out of 50 points) across all 25 indicators. However, achieving 70% is not sufficient on its own — the scheme must also have zero Critical Fail conditions. A single Critical Fail indicator scored Red renders the scheme ineligible for funding regardless of total score.
What is a Critical Fail in LTN 1/20?
A Critical Fail occurs when a Red score (0) is assigned to specific safety-critical indicators such as Junction Speed, Link Speed, Traffic Volume, Segregation, Junction Conflict, Kerbside Activity, Effective Width, or Deviation. Any Critical Fail renders the entire scheme ineligible for government cycling infrastructure funding.
What is the "murder strip" rule in LTN 1/20?
The "murder strip" refers to Criterion 12 (Segregation), where a nearside lane width between 3.2 and 3.9 metres triggers a Critical Fail. This width is too narrow for a motor vehicle to safely overtake a cyclist but too wide for the vehicle to wait behind, encouraging dangerous close-pass manoeuvres that are a leading cause of cycling casualties.
Is LTN 1/20 mandatory for all cycling schemes in England?
LTN 1/20 is mandatory for schemes funded through the Active Travel Fund and similar central government programmes. Many local authorities also apply it as a design standard for locally-funded schemes. In planning decisions, inspectors increasingly reference LTN 1/20 compliance as a material consideration for development-related cycling infrastructure.
What are the five design principles in LTN 1/20?
The five principles are Cohesion (network connectivity), Directness (competitive journey times and distances), Safety (collision risk and speed management), Comfort (surface quality and width), and Attractiveness (lighting, signing, social safety, and environment). Each principle covers a subset of the 25 CLoS indicators.
How does CLoS differ from the London Cycling Design Standards assessment?
LTN 1/20 CLoS replaced the earlier CLoS methodology from the London Cycling Design Standards (LCDS), though it shares similar DNA. The key differences are: LTN 1/20 applies nationally rather than just to London, introduces explicit Critical Fail conditions, sets a 70% pass threshold tied to government funding, and adds indicators for pedestrian impact and cycle parking.
Digitize your LTN 1/20 inspections
Replace paper forms and spreadsheets with structured digital inspections — built for standards like LTN 1/20.
Free 14-day trial. No credit card required.