




CAD-ready DXF export from your inspection data
Compose a layered DXF with labels, rings and fills, preview it in the browser, and export the same data as GeoJSON, CSV, Excel, Shapefile or GeoPackage.
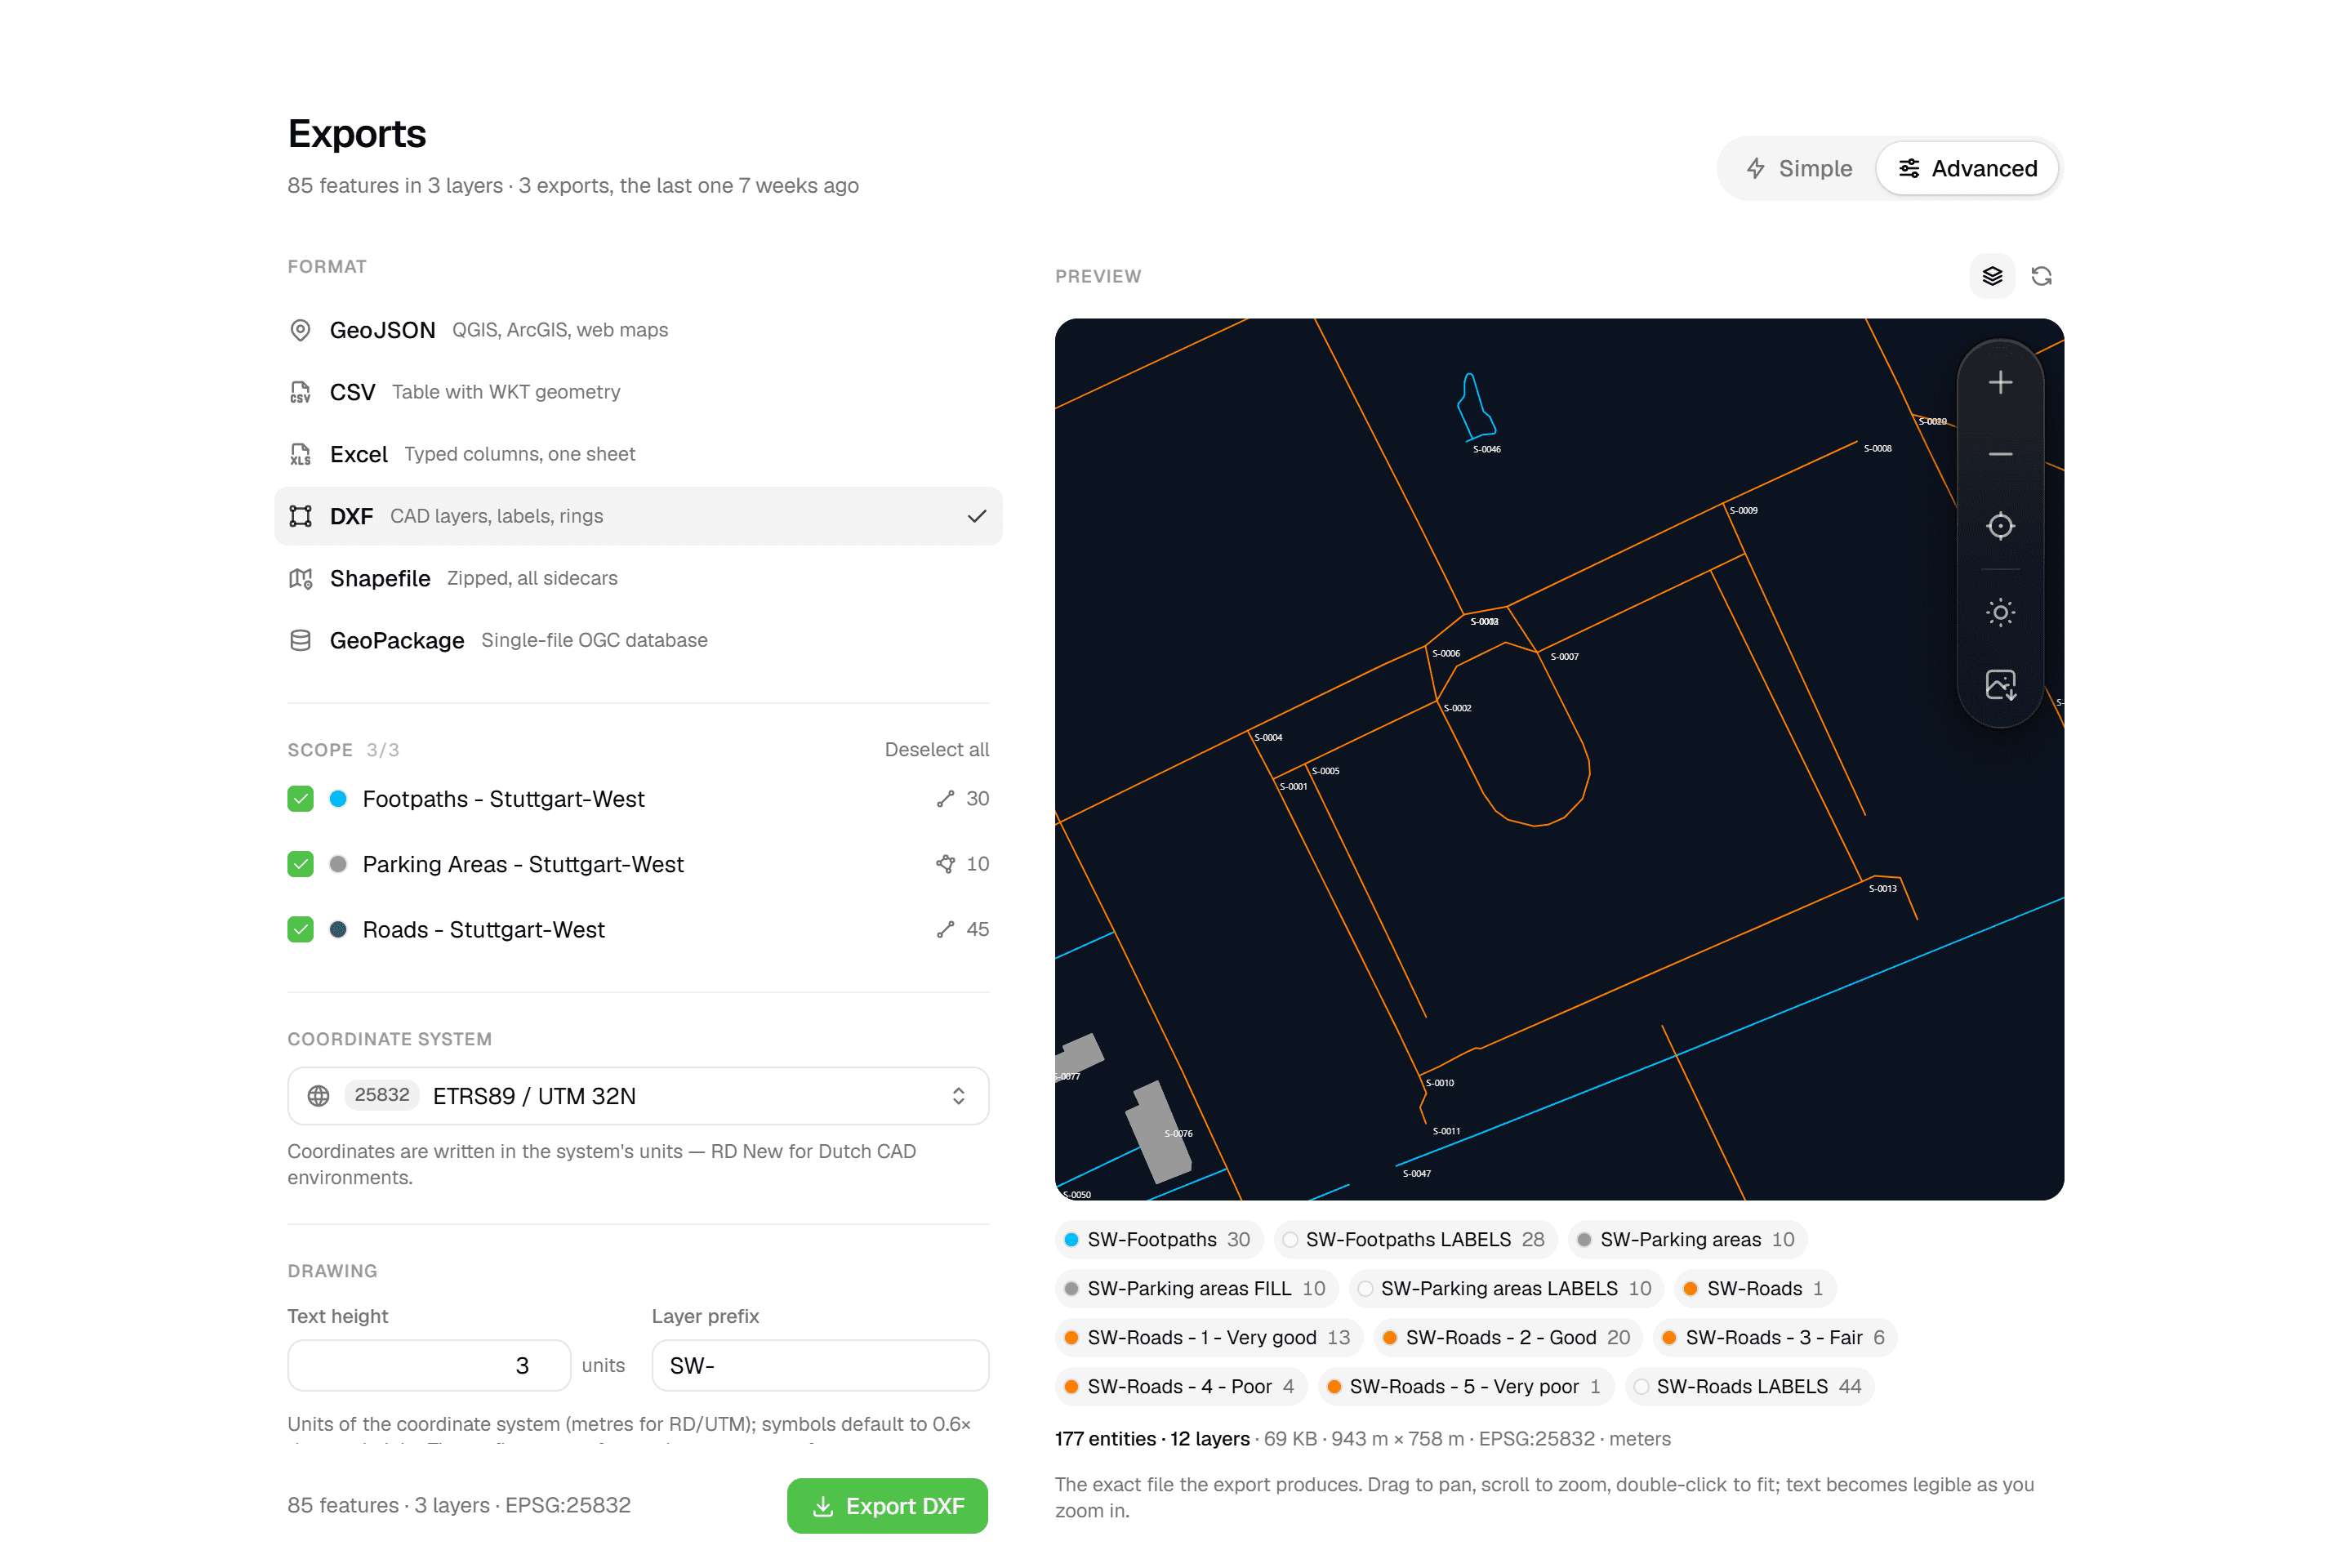
Your client works in CAD, so the deliverable should be a drawing, not a spreadsheet. Geocadra writes a DXF with one layer per project layer, labels from form fields, metadata or imported attributes, and rings around points (crown projections, clearance zones, work areas), all in the coordinate system the client's CAD environment expects, such as RD New. A live preview renders the exact file before you download it. The five data formats sit on the same page, on every plan.
The problem
The challenge with drawings made by hand
Field data leaves most tools as a table. Turning it into a drawing the client can use means plotting the points again in CAD, colouring layers by hand, typing a number next to every symbol and drawing each crown projection as its own circle. When a re-inspection changes the data, the drawing is out of date and the work starts over.
The solution
The drawing is built from the data
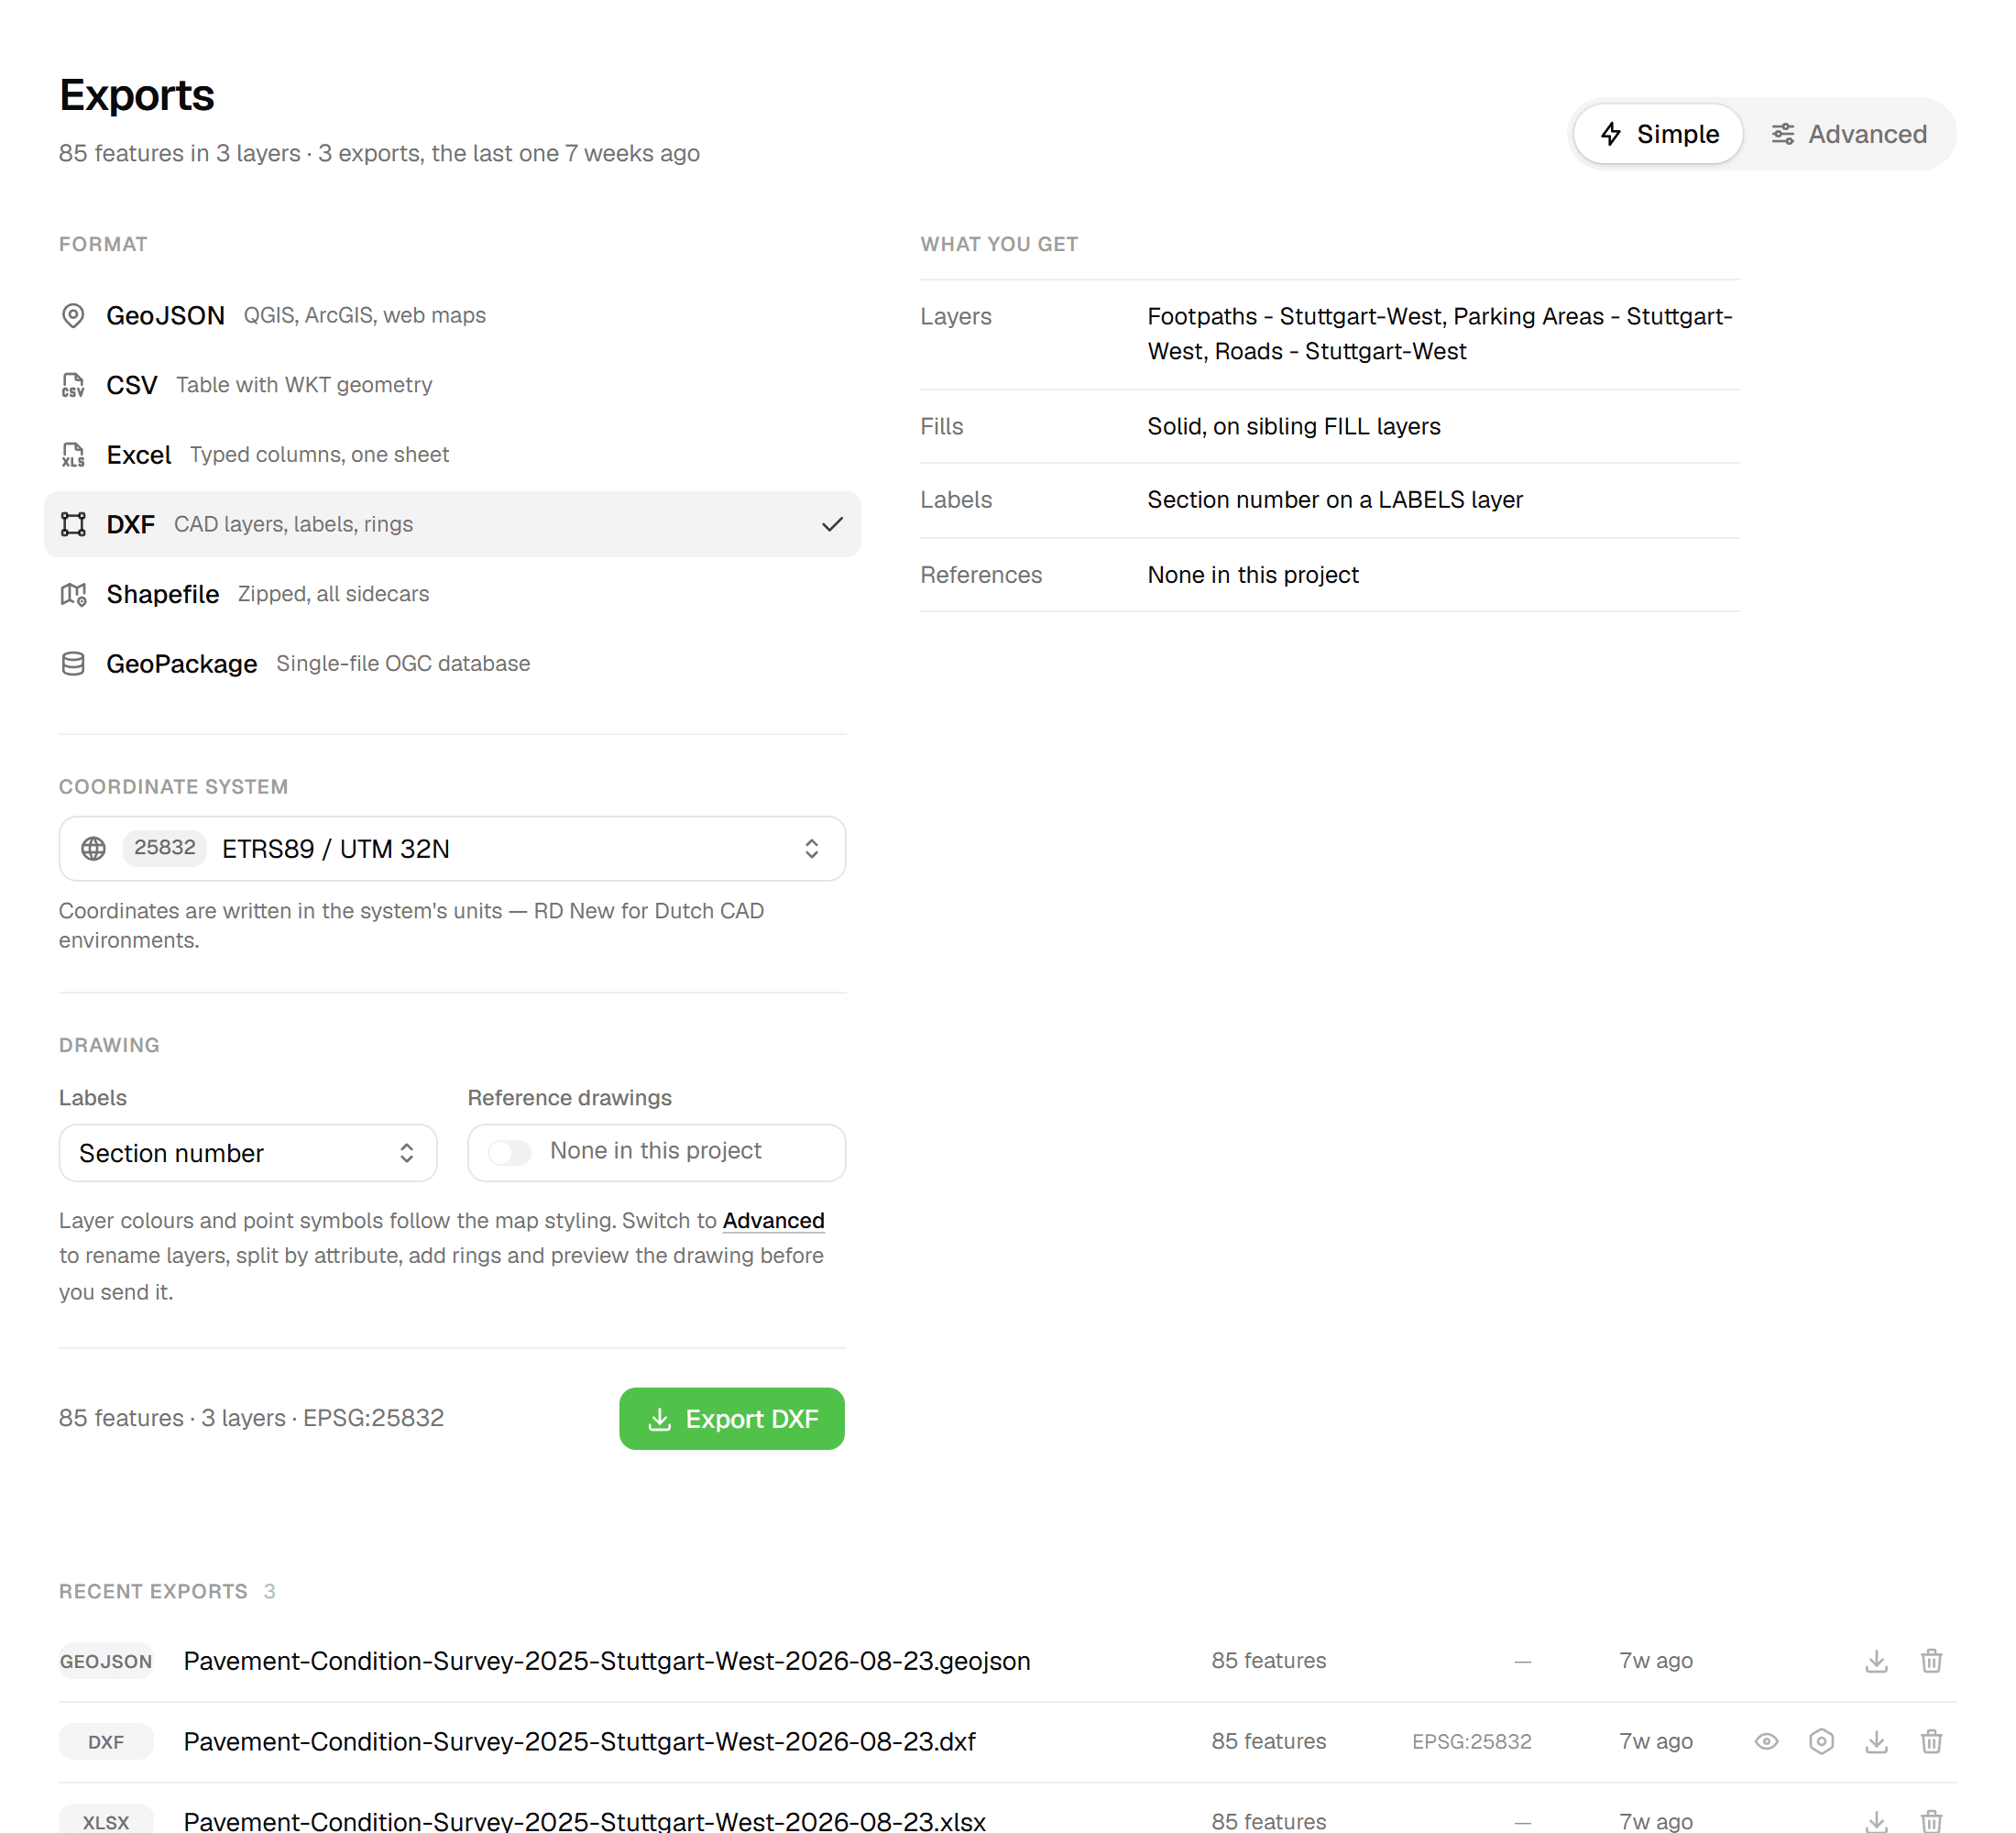
Geocadra composes the drawing from the data. In 'Simple' mode you pick DXF and answer at most three questions: coordinate system, a label field, reference drawings. Layer colours and point symbols follow the map styling automatically. In 'Advanced' mode you name layers, split them into sub-layers by status or any field, add up to 6 labels per layer and 6 rings per point layer and write your reference drawings into the same file. The preview runs the same pipeline as the export, so what you preview is byte-for-byte what gets exported.
Key benefits
- Layered DXF with labels, rings and fills
- Live preview that is byte-for-byte the export
- RD New, UTM, Lambert 72 and more coordinate systems
- GeoJSON, CSV, Excel, Shapefile and GeoPackage on every plan
- Reference drawings written into the same DXF
- Reuse the drawing settings of a past DXF export
How It Works
- 01
Pick a format in Simple mode
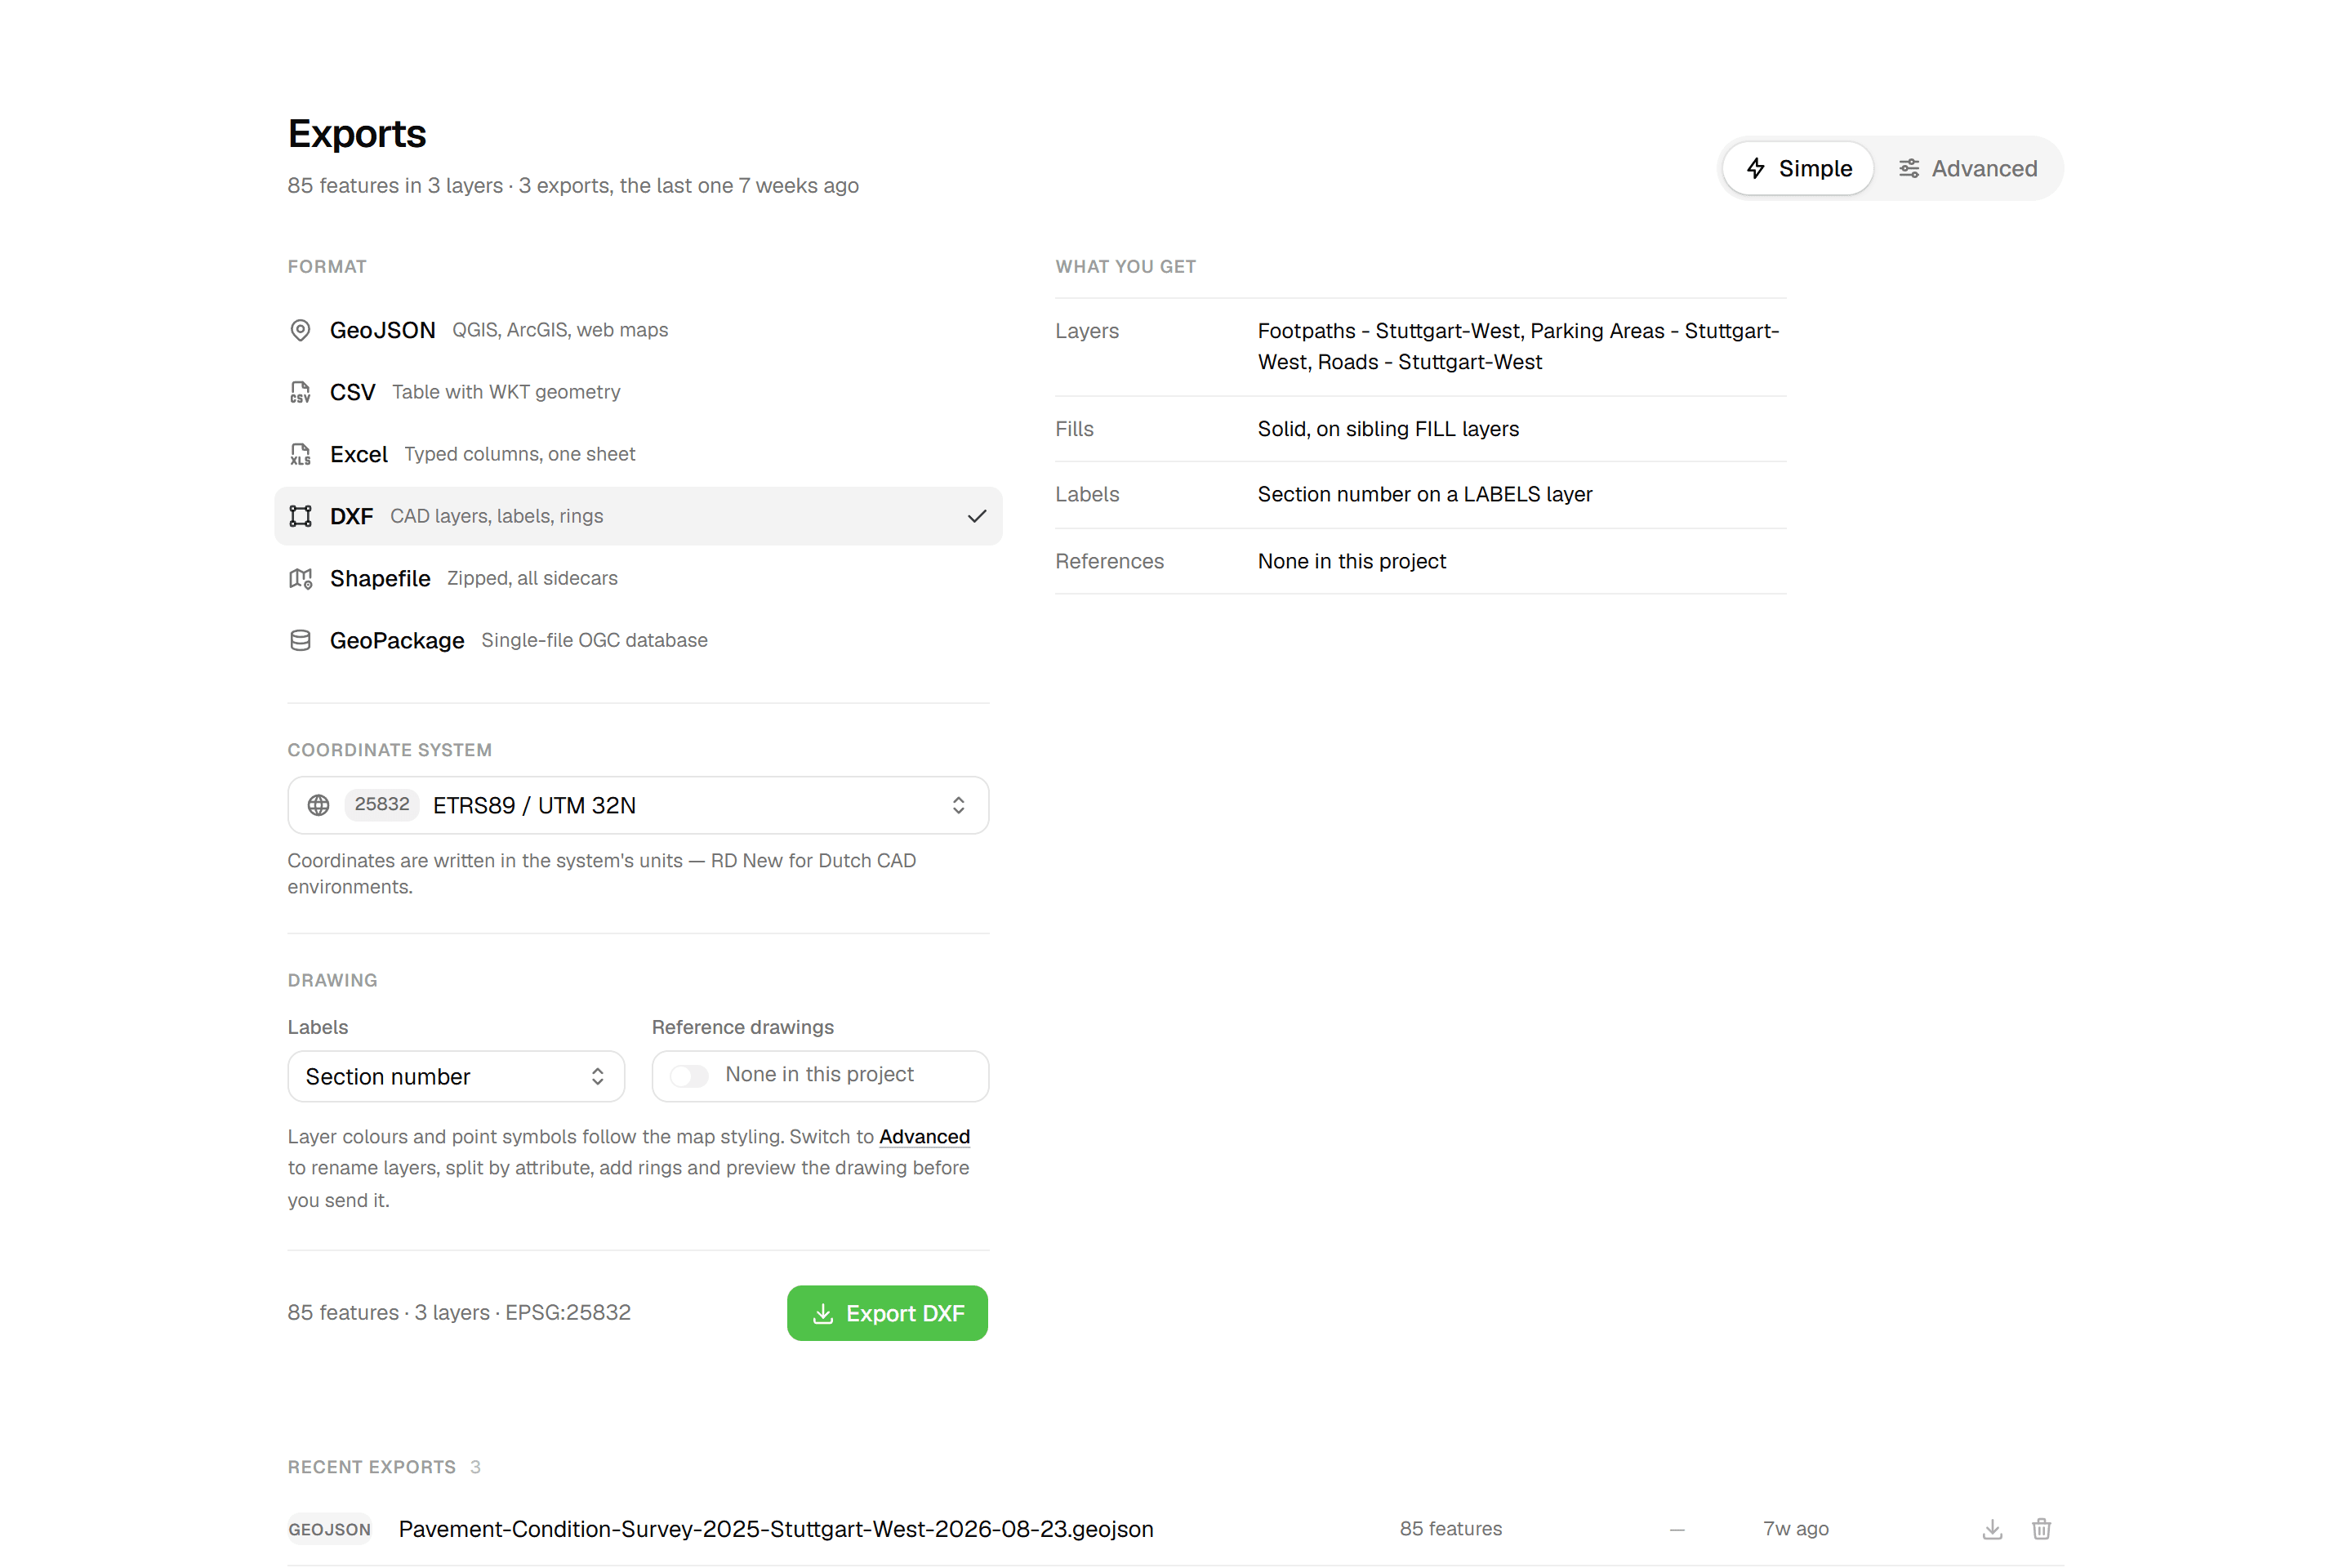
Open Exports from the project overview and choose GeoJSON, CSV, Excel, DXF, Shapefile or GeoPackage. For DXF, Simple mode asks at most three questions: coordinate system, one 'Labels' field such as Status or a tree number, and a 'Reference drawings' switch to include your reference drawings in grey. A 'What you get' list updates live as you answer.
- 02
Compose layers, labels and rings in Advanced
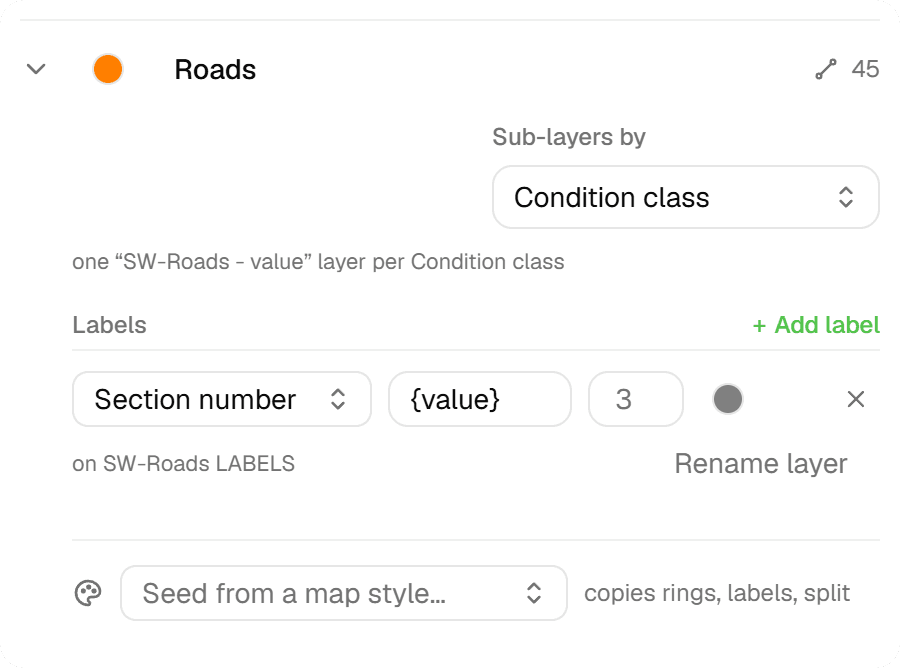
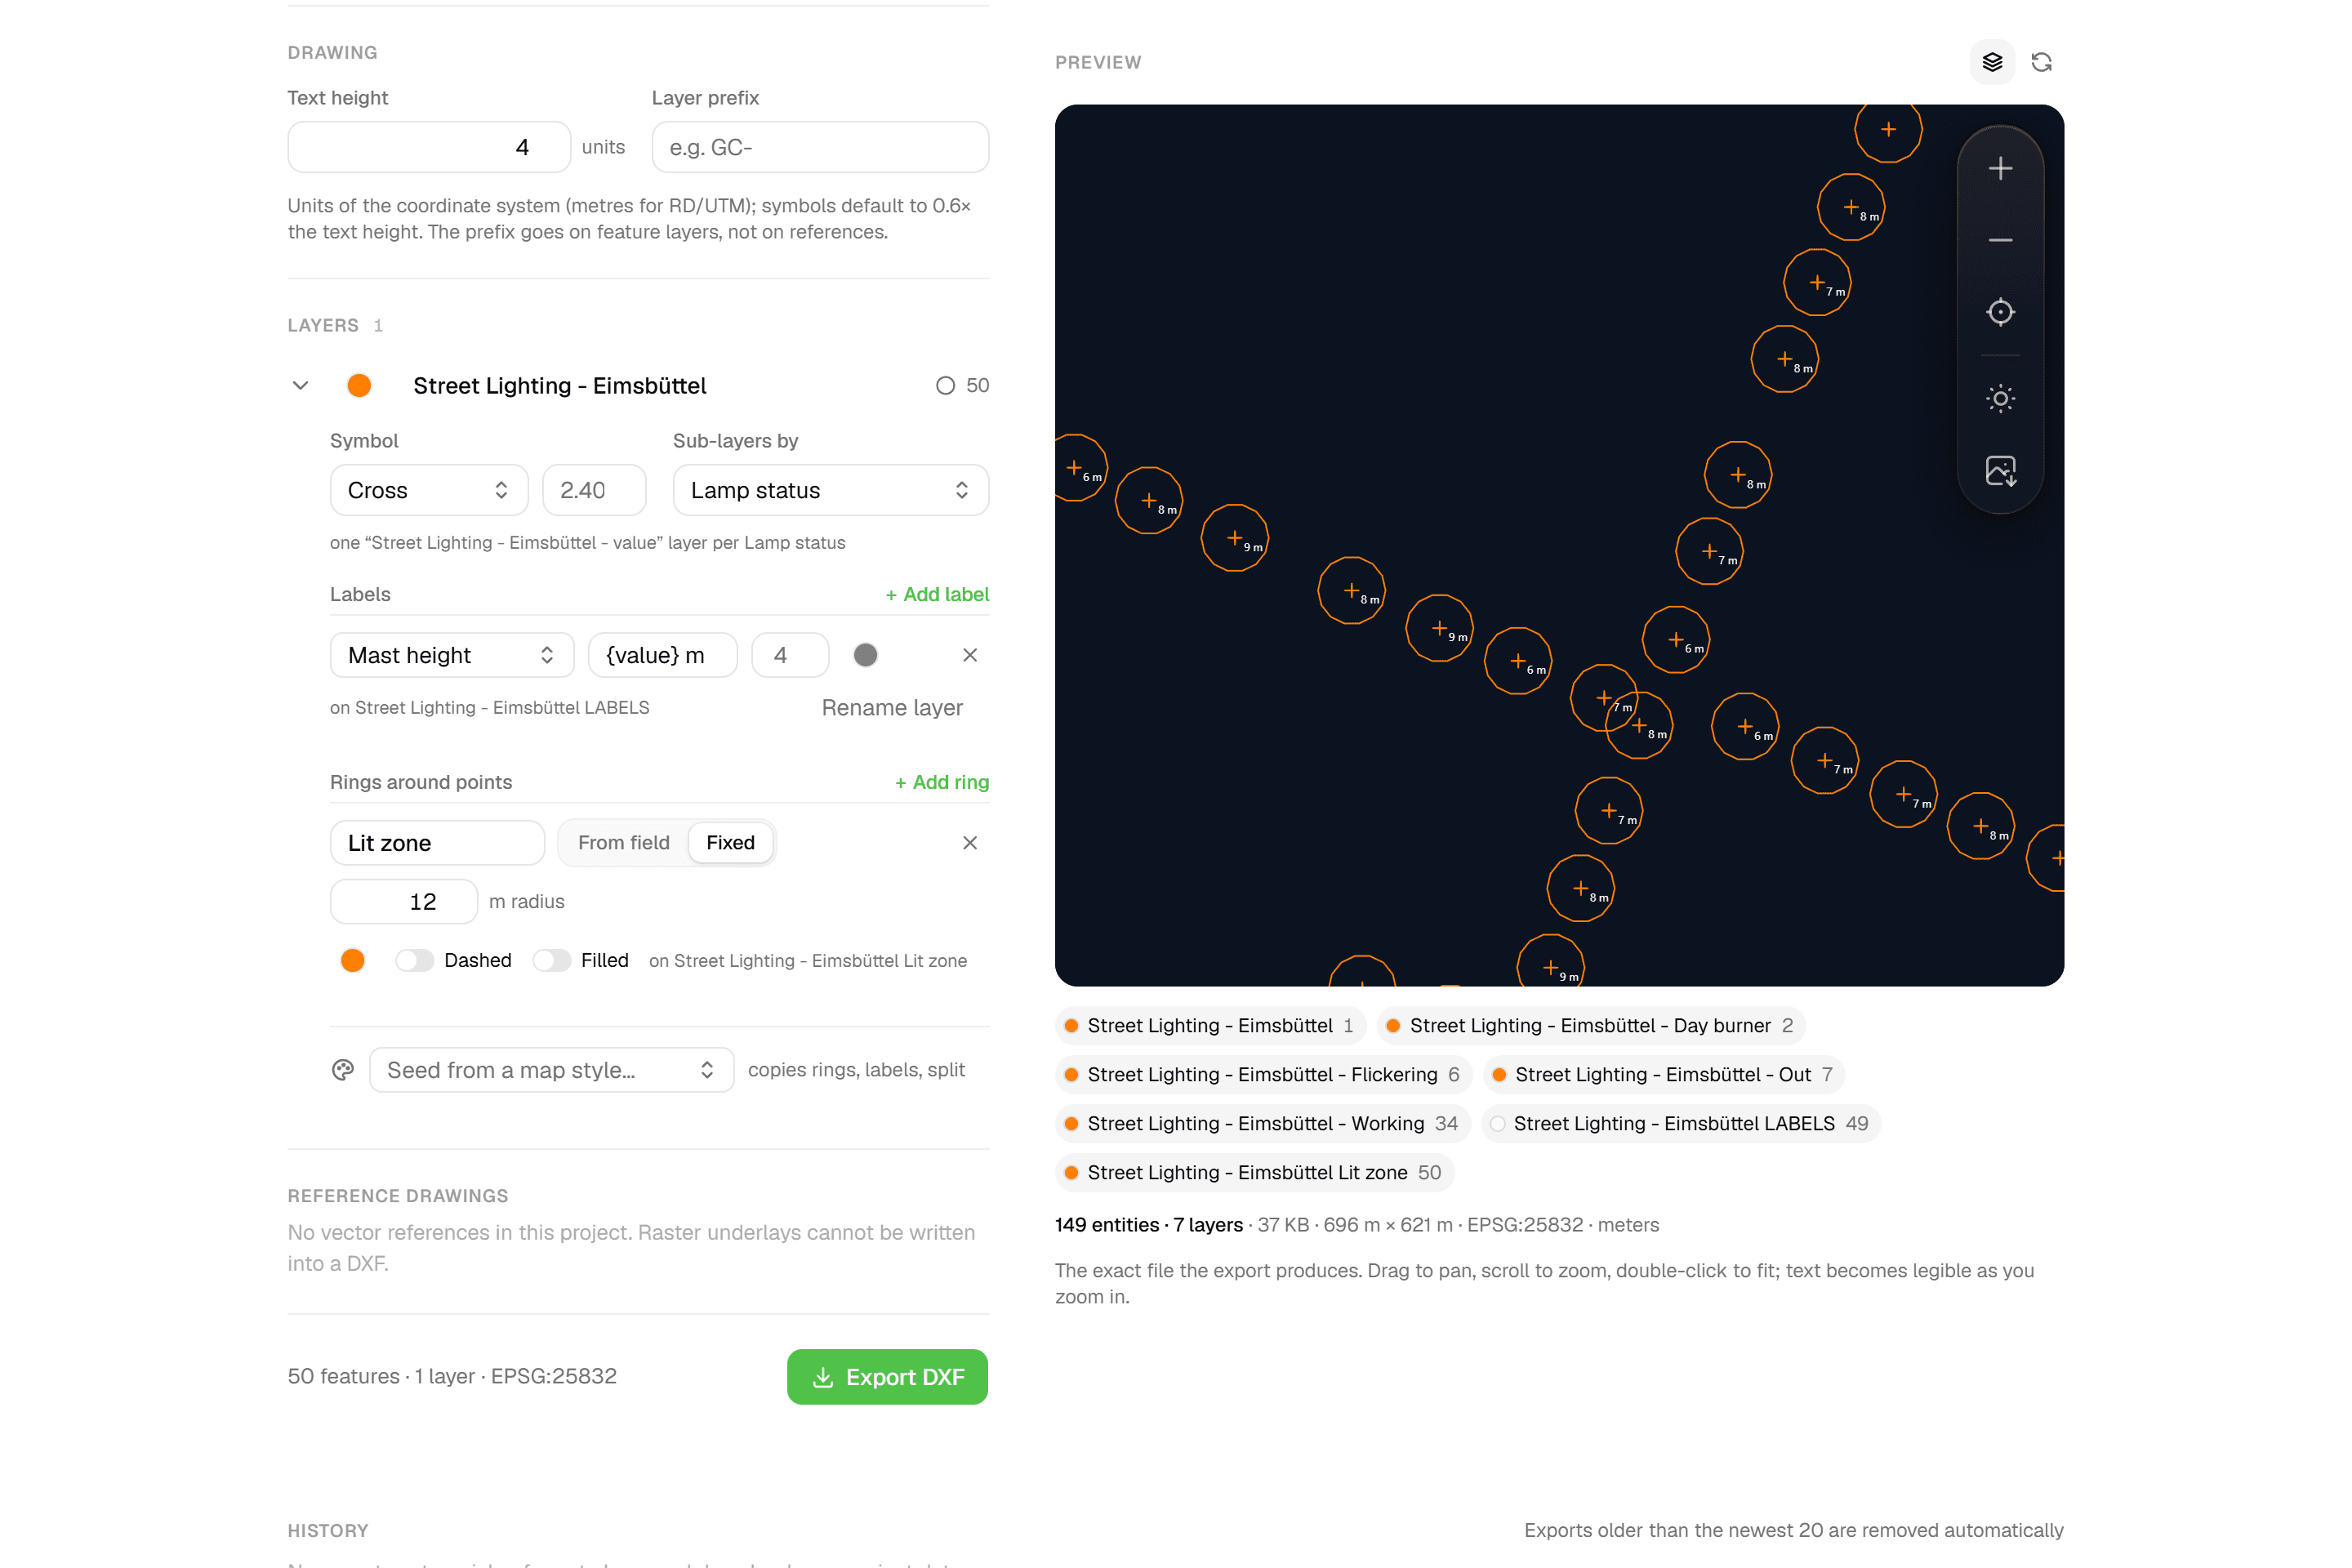
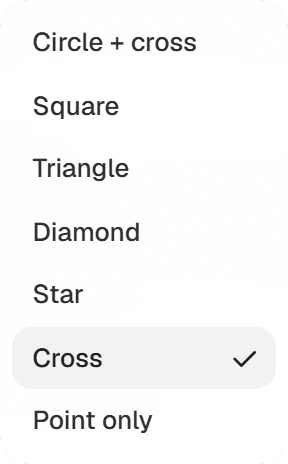
Switch to 'Advanced' for an inspector beside the preview. Per layer, pick an AutoCAD colour, rename the DXF layer, choose one of 7 point symbols or 5 fill patterns, and split it into sub-layers by any field with 'Sub-layers by'. Add up to 6 labels, each with a '{value}' template such as 'Ø {value} cm', and up to 6 rings from a numeric field or a fixed radius in metres, dashed or filled. 'Seed from a map style…' copies rings, labels and sub-layers from a saved map style preset.
- 03
Check the live preview
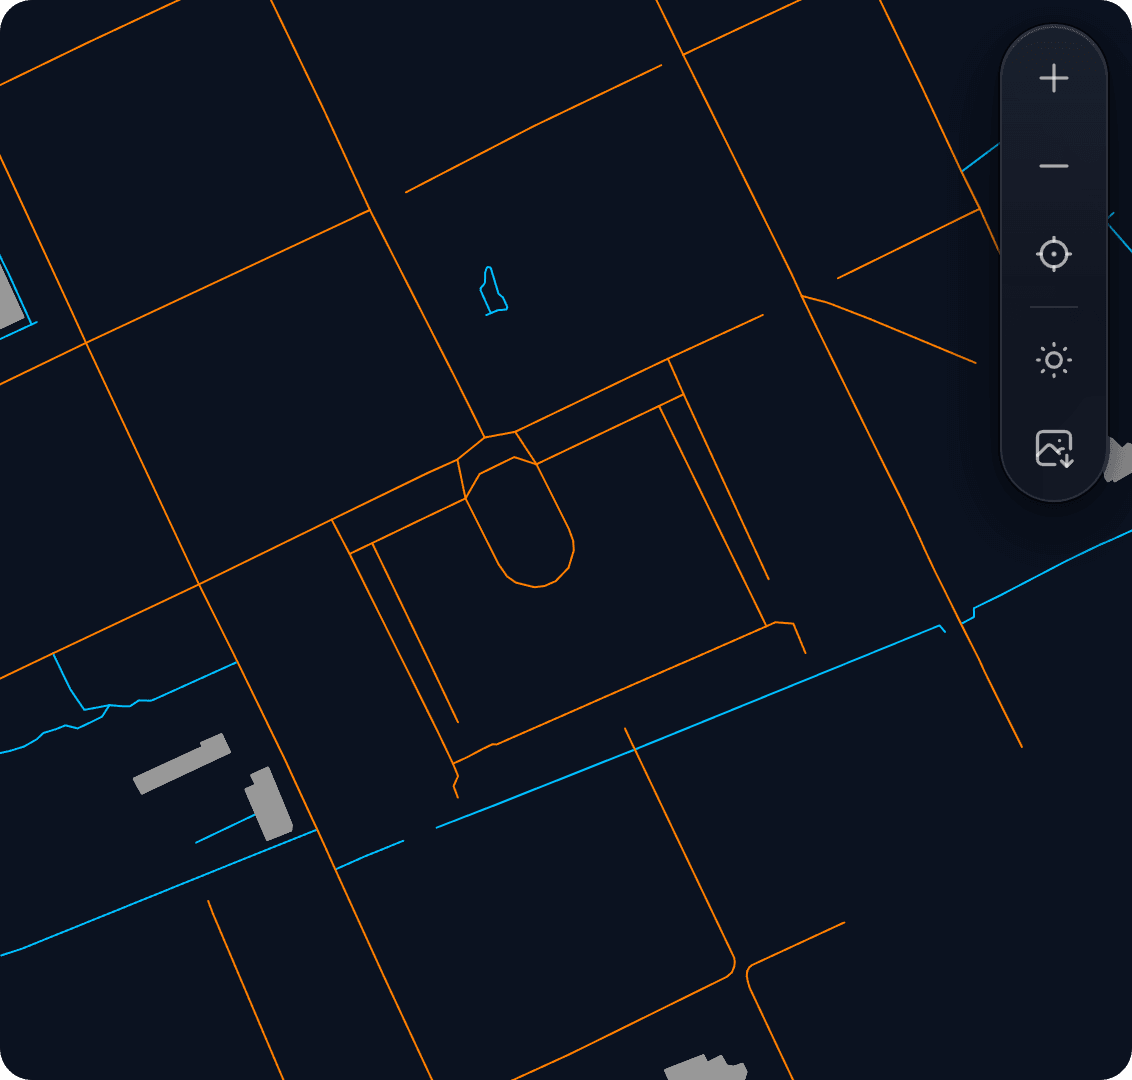
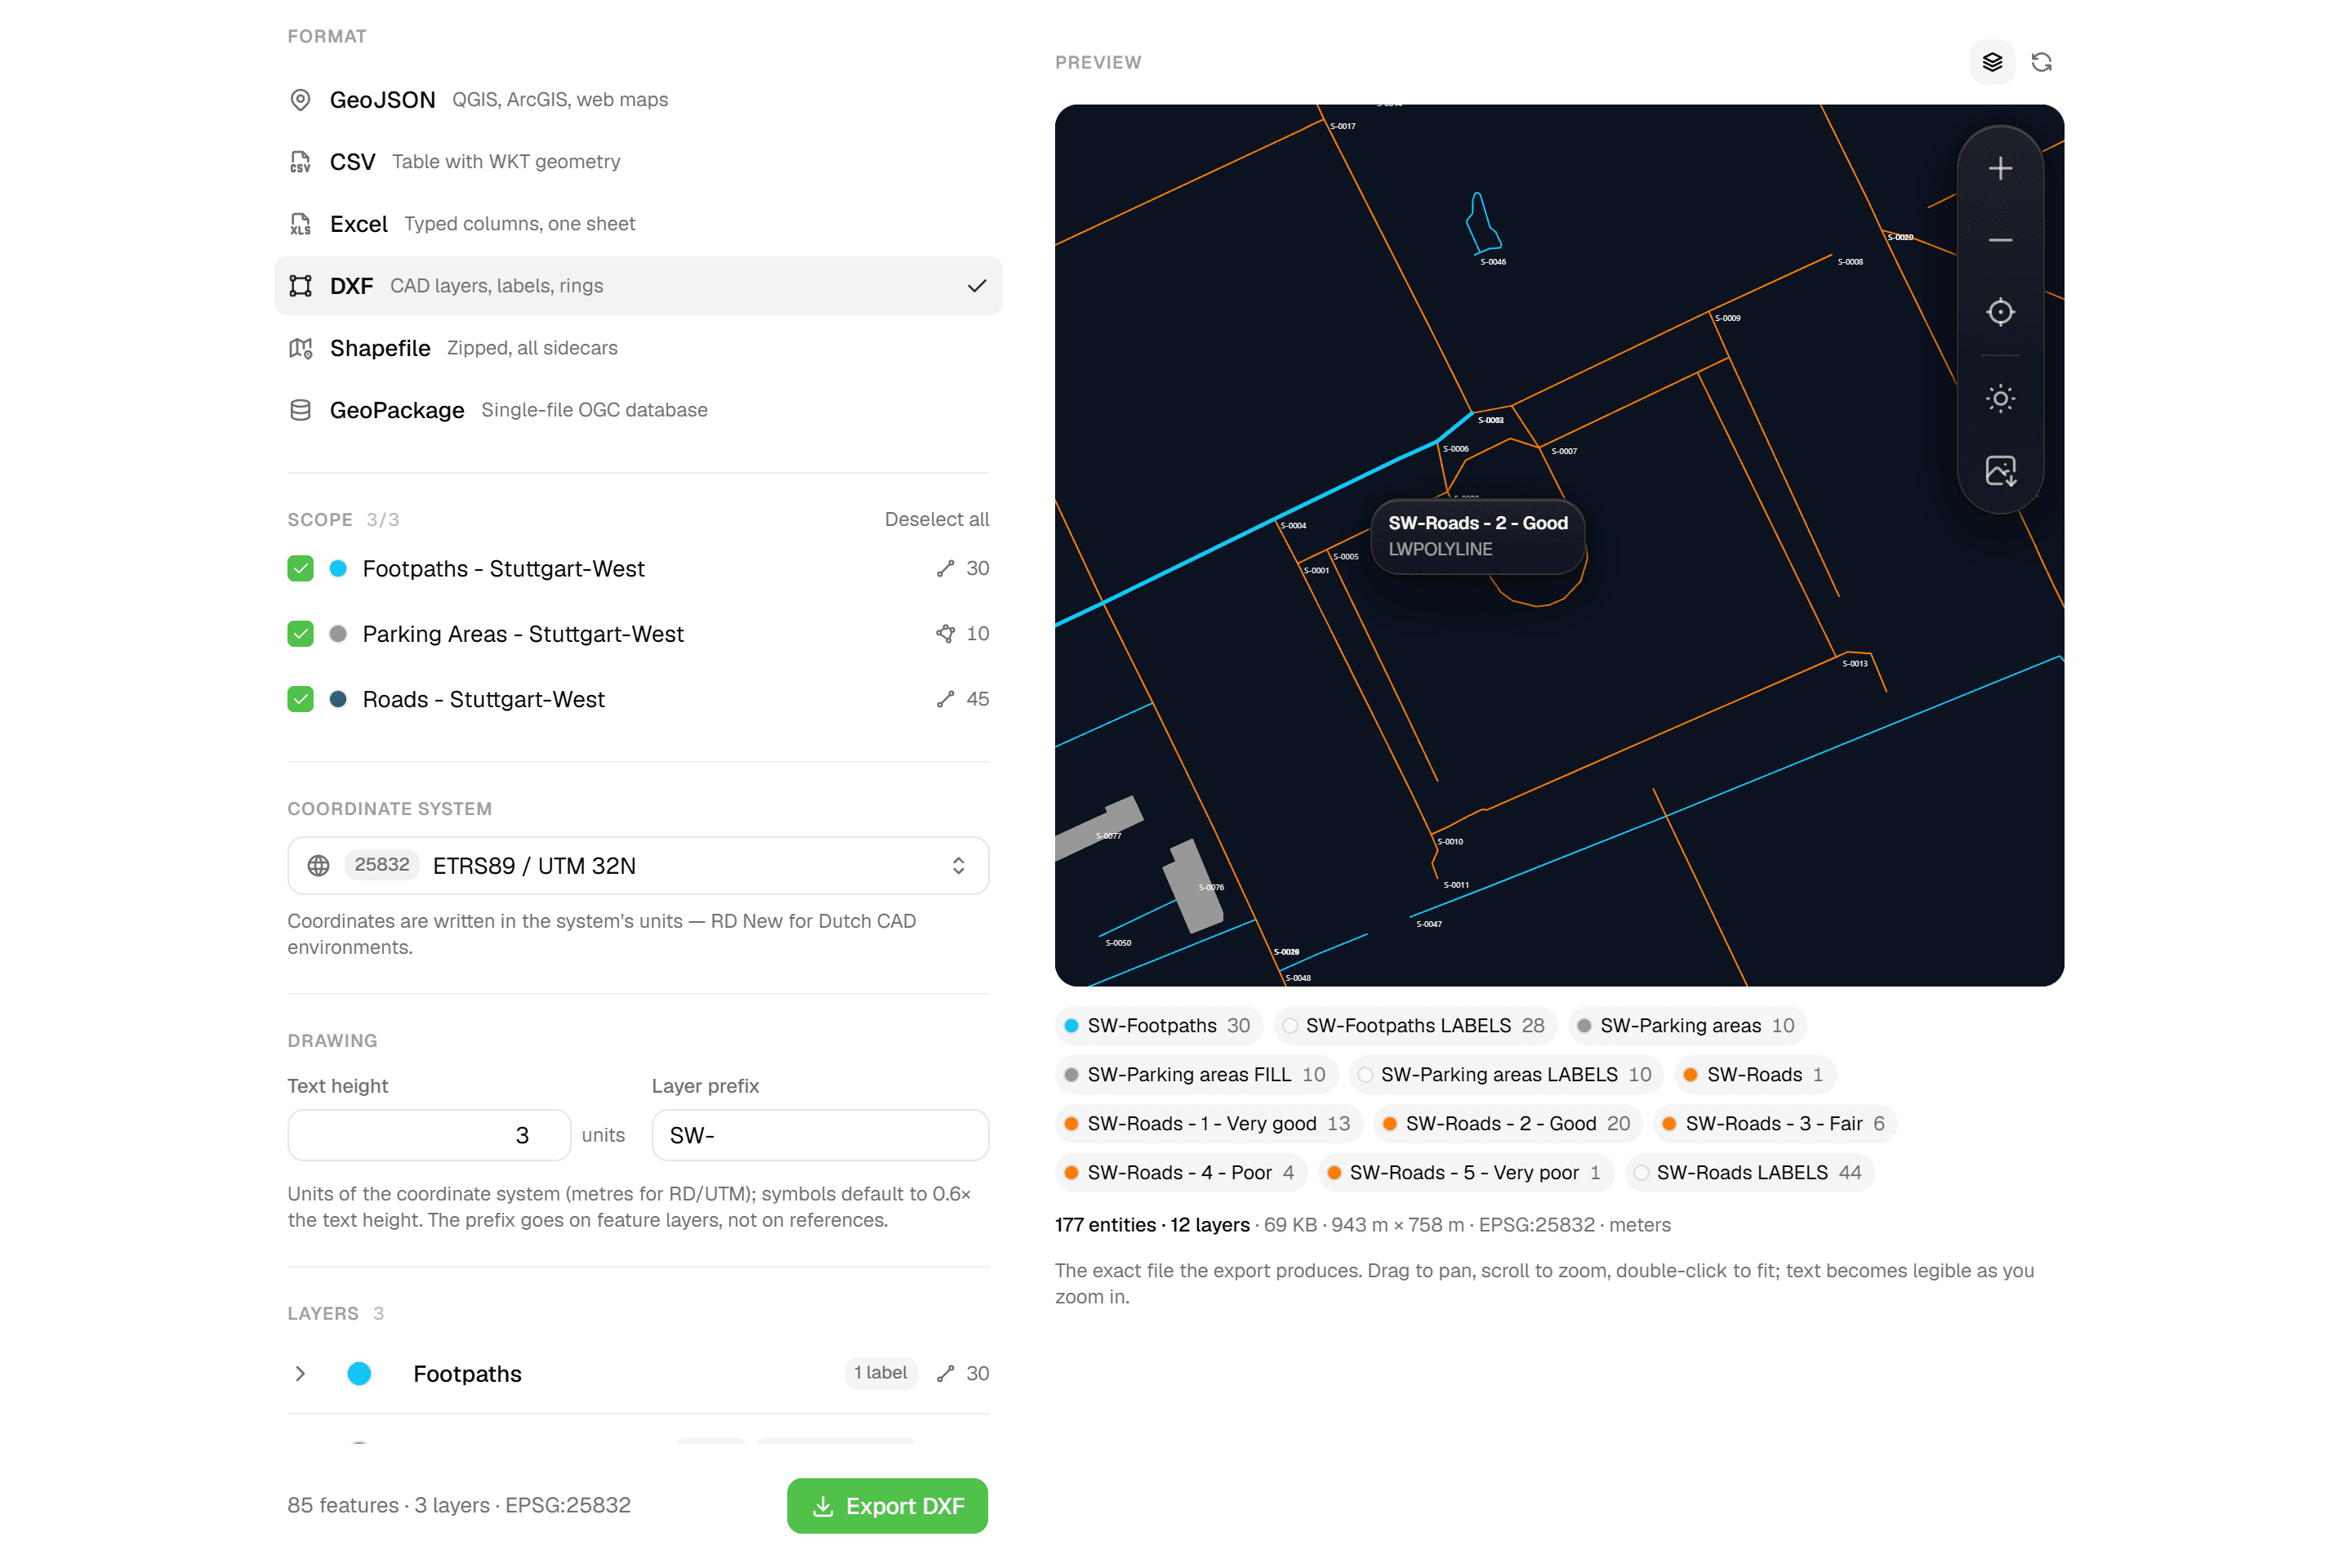
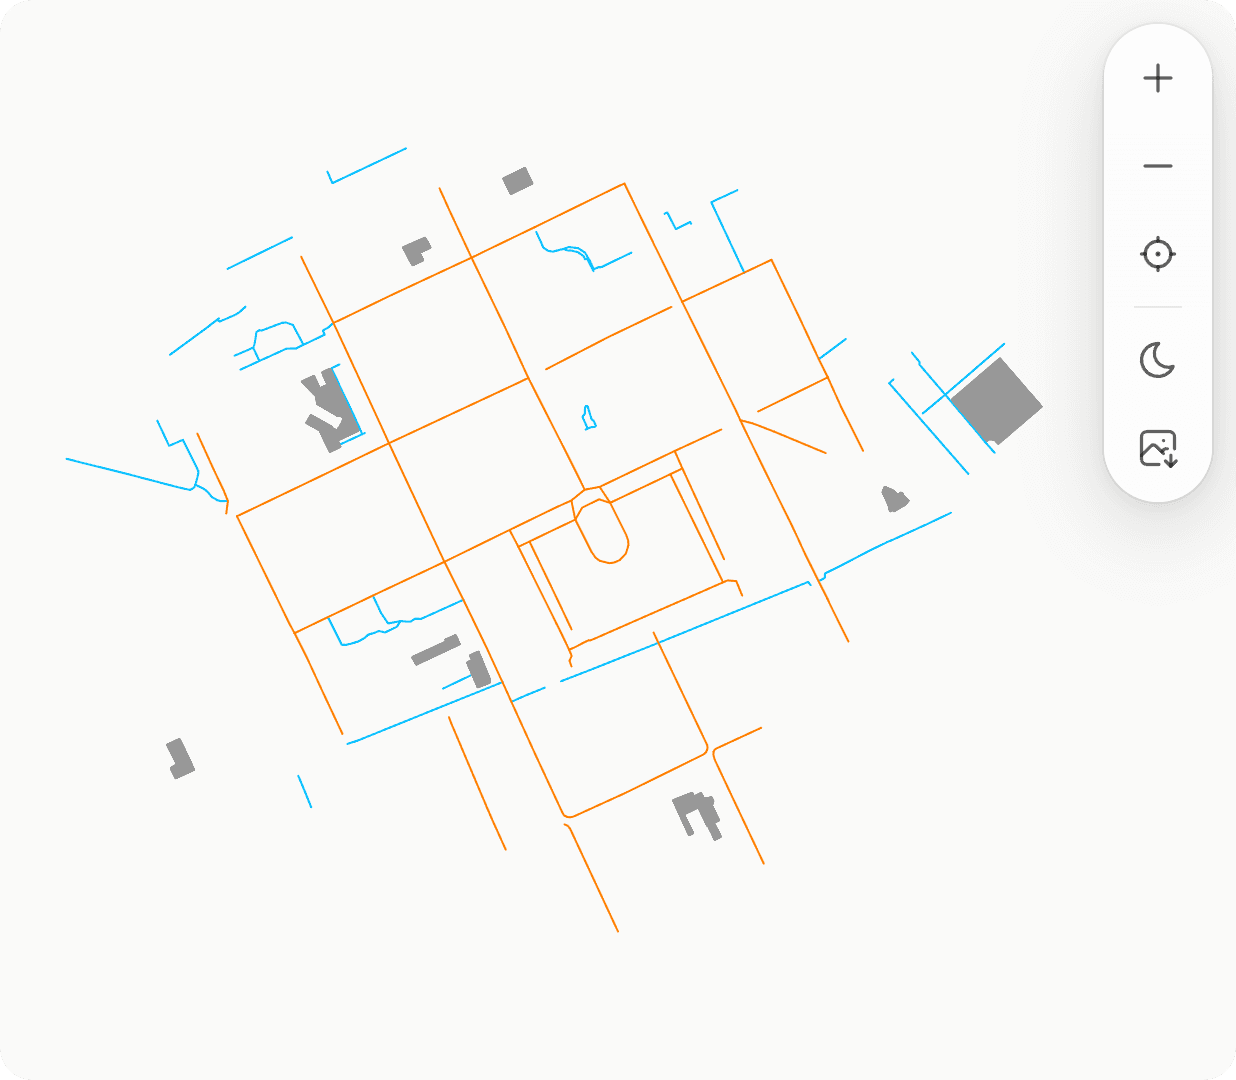
The preview is rendered by the same pipeline as the stored export. Drag to pan, scroll to zoom, double-click to fit, toggle layers in the legend, switch between a dark and a light CAD background and hover an entity to see its layer and type. Warnings show inline before you export: features outside the coordinate system's domain, a split-by cap exceeded, a reference not ready.
- 04
Export, then reuse the settings
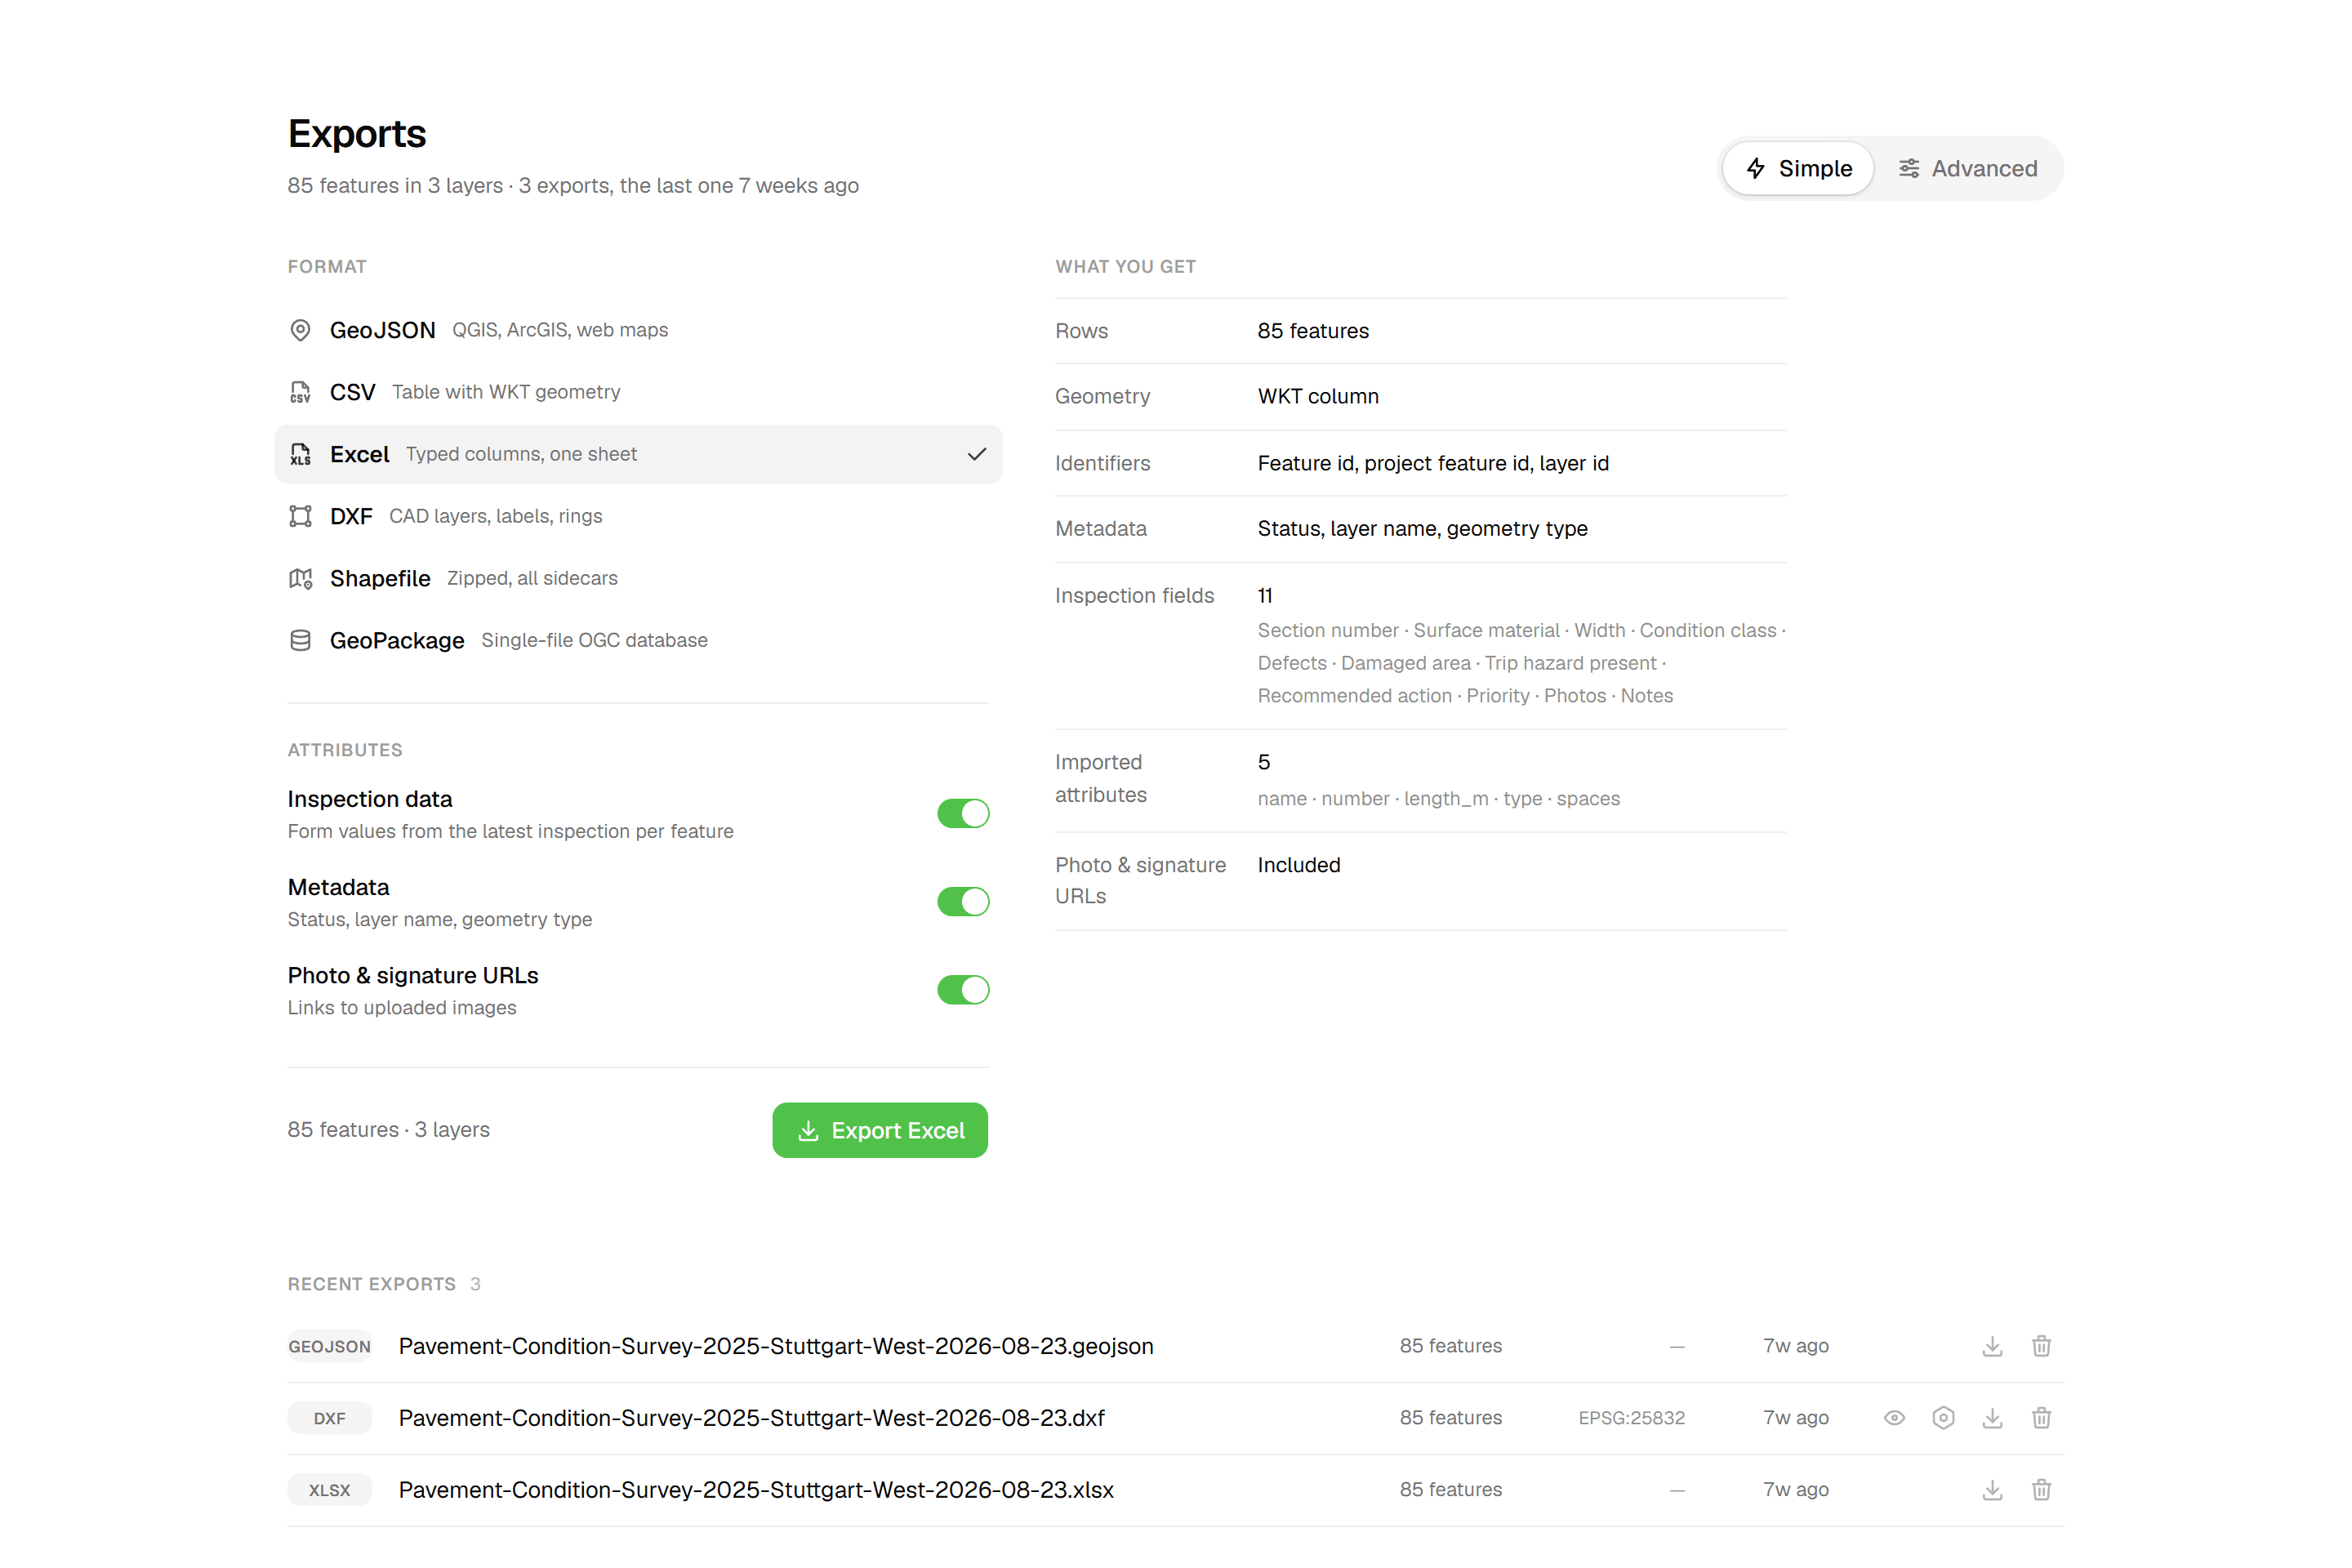
Export starts the download immediately, named after the project and the date. Every export lands in the history table, where you can download it again or delete it. For DXF exports you can also preview the drawing in the browser or load the complete settings back into the composer with 'Reuse drawing settings', coordinate system and layer scope included. The newest 20 exports per project are kept.

Common Use Cases
- 01
Tree surveys with crown projections
Export tree points with a ring per tree sized from a crown diameter field, the tree number as a label and the status as sub-layers, over the client's design drawing in grey. In a projected coordinate system such as RD New, rings are written as true CIRCLE entities.
- 02
Drawings on the client's design
Include your reference drawings (the client's DXF or a georeferenced DXF) in the export. Keep their sub-layers with a prefix such as 'REF-' or flatten them to one layer, in grey or in their original colours, with or without their texts, and pick exactly which sub-layers to include.
- 03
GIS and desktop analysis
Export GeoJSON for QGIS, ArcGIS and web maps, or a zipped Shapefile with all sidecars and a single-file GeoPackage with an optional target coordinate system. Limit the export to chosen layers in Advanced mode and choose which attributes to include.
- 04
Excel for the office
The Excel export is one 'Features' worksheet with typed columns (numbers and booleans stay typed), a 'Geometry (WKT)' first column, a bold frozen header row and human-readable form field labels. Toggle 'Inspection data', 'Metadata' and 'Photo & signature URLs' to decide what goes in.
Frequently Asked Questions
Which export formats are available?
Six: GeoJSON, CSV with a WKT geometry column, Excel (XLSX) with typed columns, DXF in the AutoCAD 2018 (R2018) drawing format, zipped Shapefile with all sidecars, and GeoPackage. GeoJSON, CSV, Excel, Shapefile and GeoPackage are available on every plan. DXF export is available on the Pro plan and up.
Which coordinate systems can I export to?
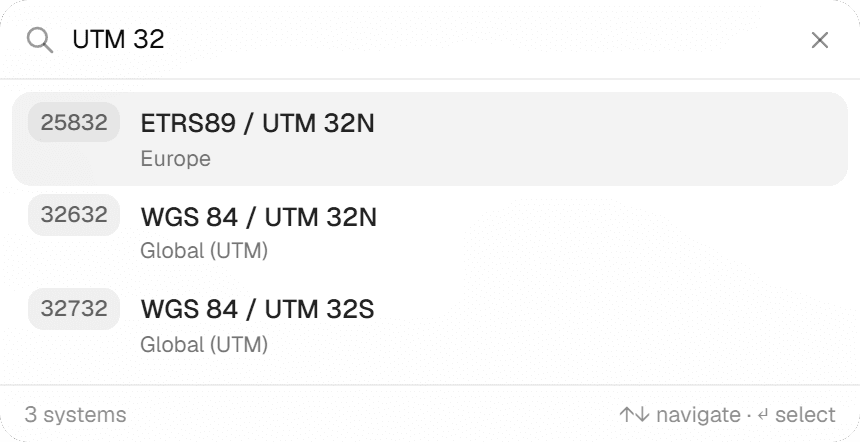
The picker is a searchable catalog: RD New (EPSG:28992), WGS 84, Web Mercator, Belgian Lambert 72 and Lambert 2008, British National Grid, Swiss LV95 and LV03, German Gauss-Kruger, French Lambert 93, Austrian MGI and the WGS 84, ETRS89 and NAD83 UTM zones. DXF requires a coordinate system and writes coordinates in its units; Shapefile and GeoPackage take an optional one and default to WGS 84; GeoJSON, CSV and Excel are never reprojected. RD New uses the RDNAPTRANS2018 correction grid.
Does the inspection data travel inside the DXF?
Labels are the way to put data on the drawing: up to 6 per layer, each from a form field, metadata or imported attribute, formatted with a '{value}' template, with its own text height and colour, stacked on a <layer> LABELS layer. For the full attribute table, export Excel or CSV next to the DXF.
What are rings?
Circles drawn around point features: crown projections, clearance zones, work areas. A ring takes its radius from a numeric field, read as radius or diameter (a value like '15-17 m' parses to its midpoint), or from a fixed number of metres. Each ring gets its own layer suffix and colour and can be dashed or filled. Up to 6 per point layer; rings are drawn around point features only.
Do I need CAD software to check the drawing?
No. The in-app viewer renders the DXF in the browser: drag to pan, scroll to zoom, double-click to fit, per-layer visibility, a dark or light CAD background, a hover tooltip with layer name and entity type, and 'Save preview as PNG'. Past DXF exports open in the same viewer from the history table with 'Preview drawing'.
Who can export, and how long are exports kept?
Any project viewer can export and preview; deleting an export requires its creator or a project editor. The newest 20 exports per project are kept and older ones are removed automatically. Downloads go through an authenticated link, and the project overview shows the last three ready exports for one-click download.
Explore More Features
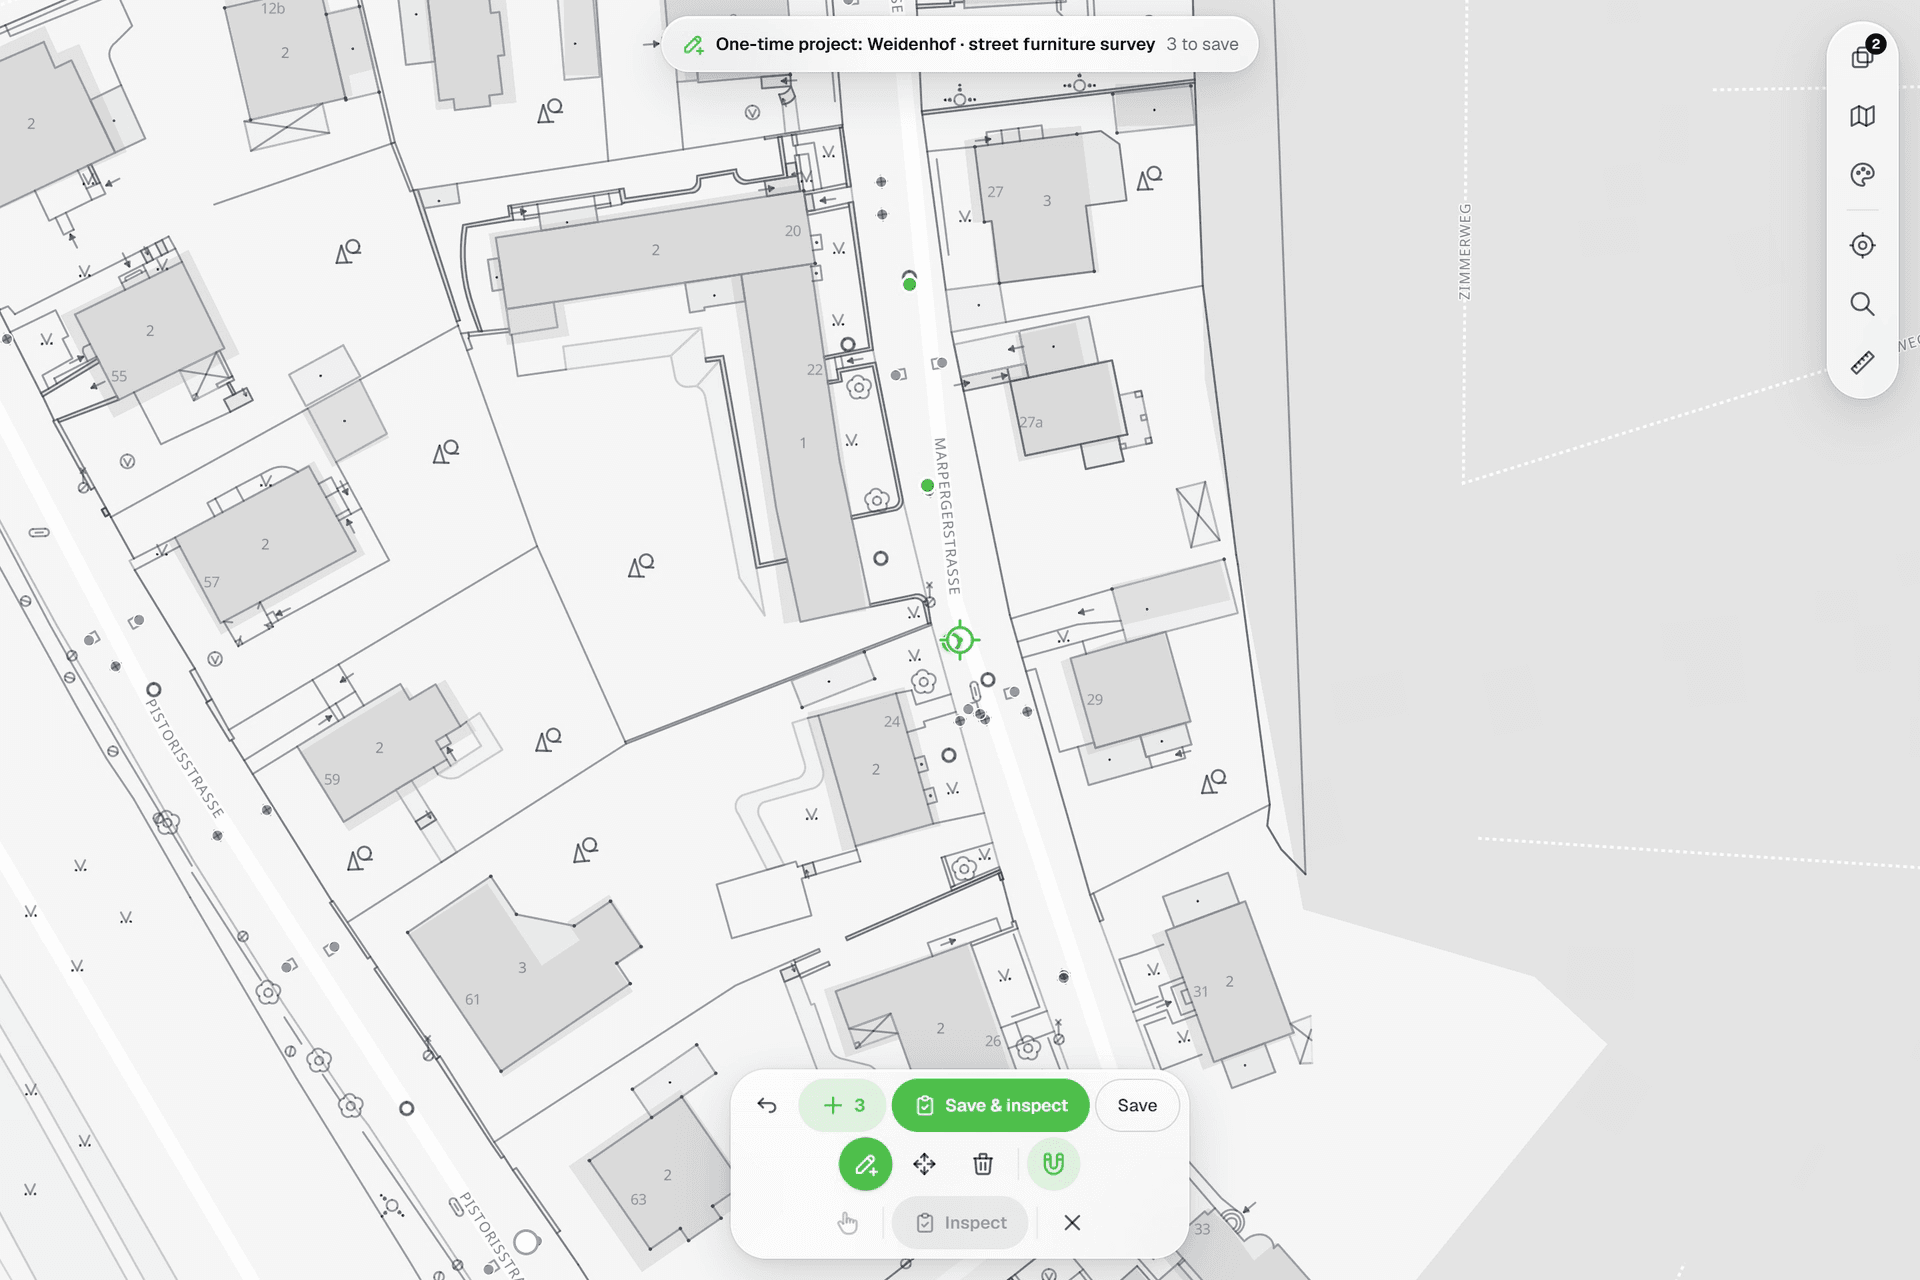 See everything on the mapPoints, lines and polygons over street maps, aerials, BGT and any CAD drawing you upload as reference. Place and correct geometry with a crosshair that snaps to the drawing.
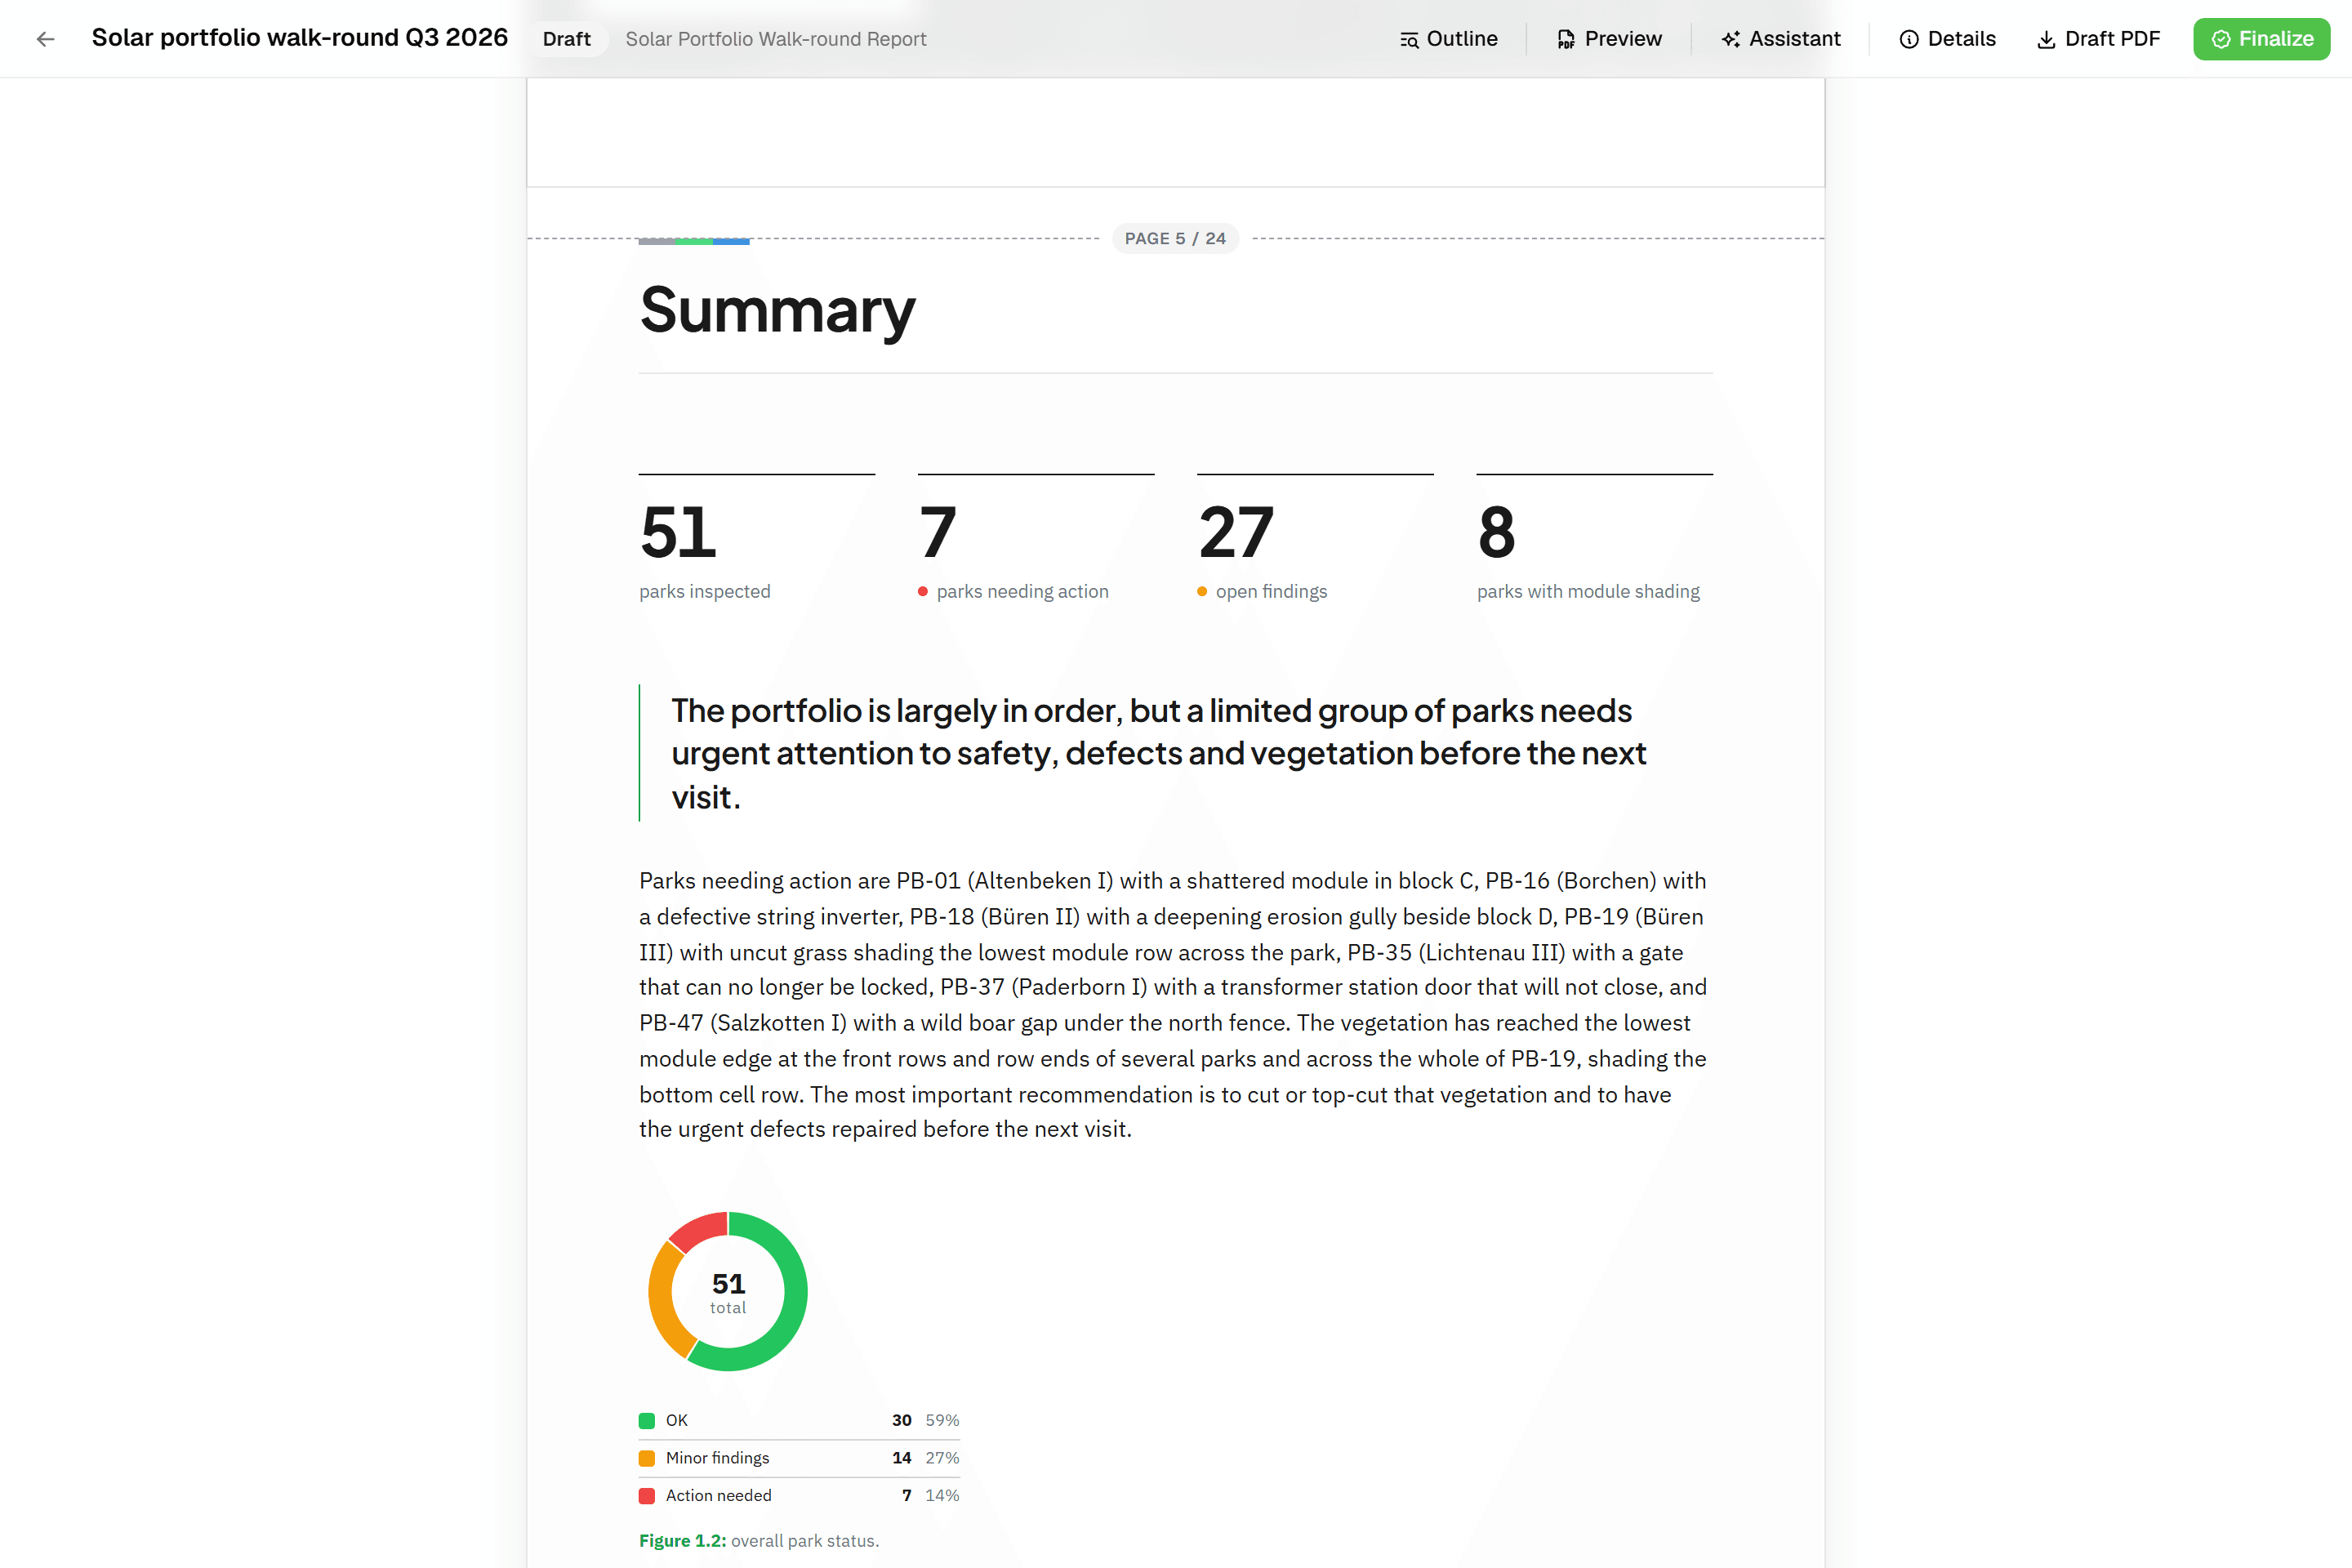 Reports that assemble themselvesBlock-based reports with live data tables, photo appendices, map figures and an AI assistant. Live PDF preview; finalize to an immutable PDF, revise as rev. B.
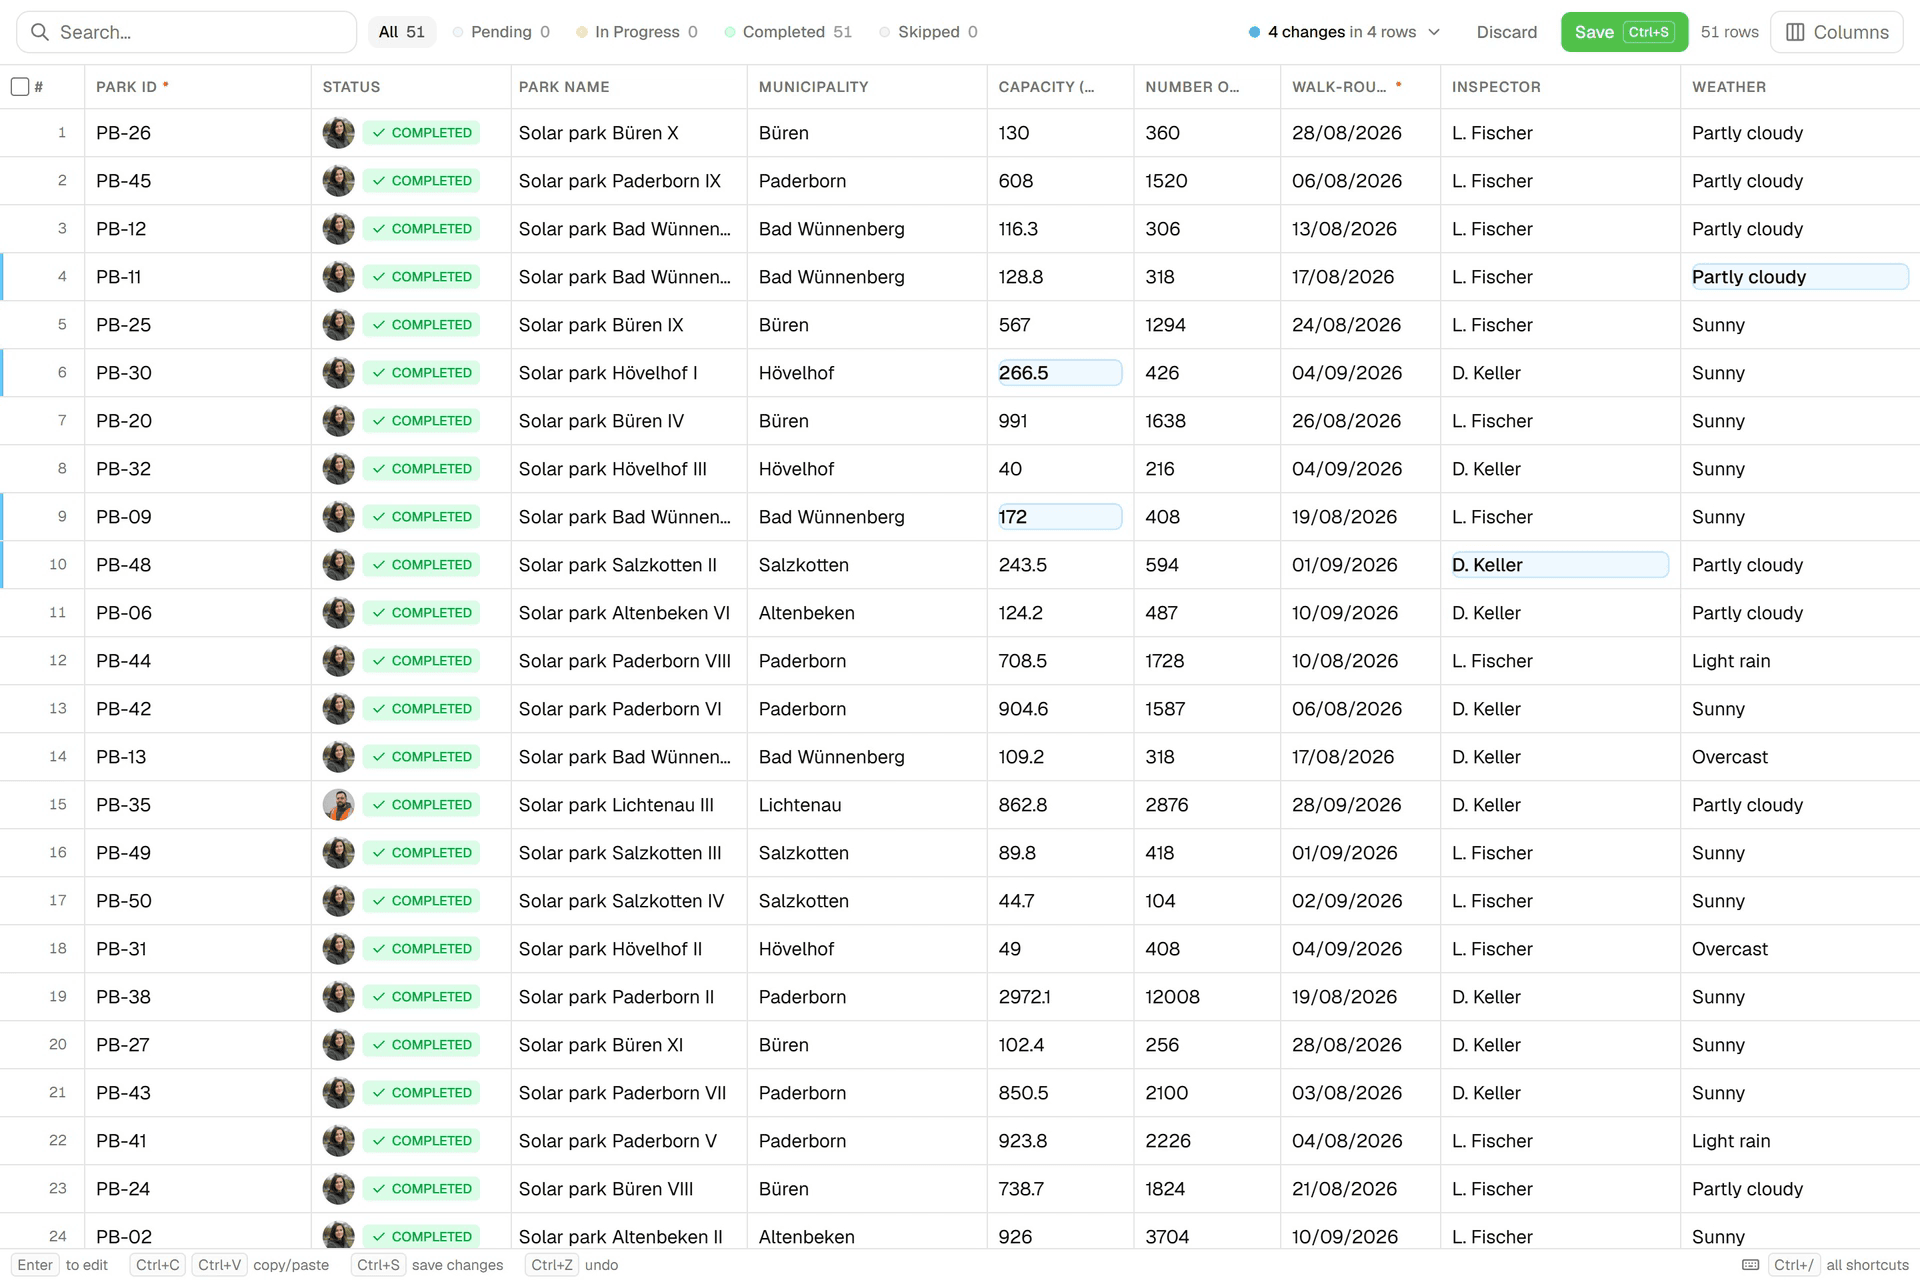 Edit data like a spreadsheetAn Excel-like grid per layer: paste from Excel, fill down, filter, bulk-edit. Review every change before you save; each save lands in the feature's version history.
Try it on your own data
Set up a project and see your own data on the map. Free for 14 days, no credit card.
No credit card requiredFree trial included