Inspection reports that assemble themselves
Block-based reports with live data tables, photo appendices and map figures, finalised as an immutable PDF with real page numbers.
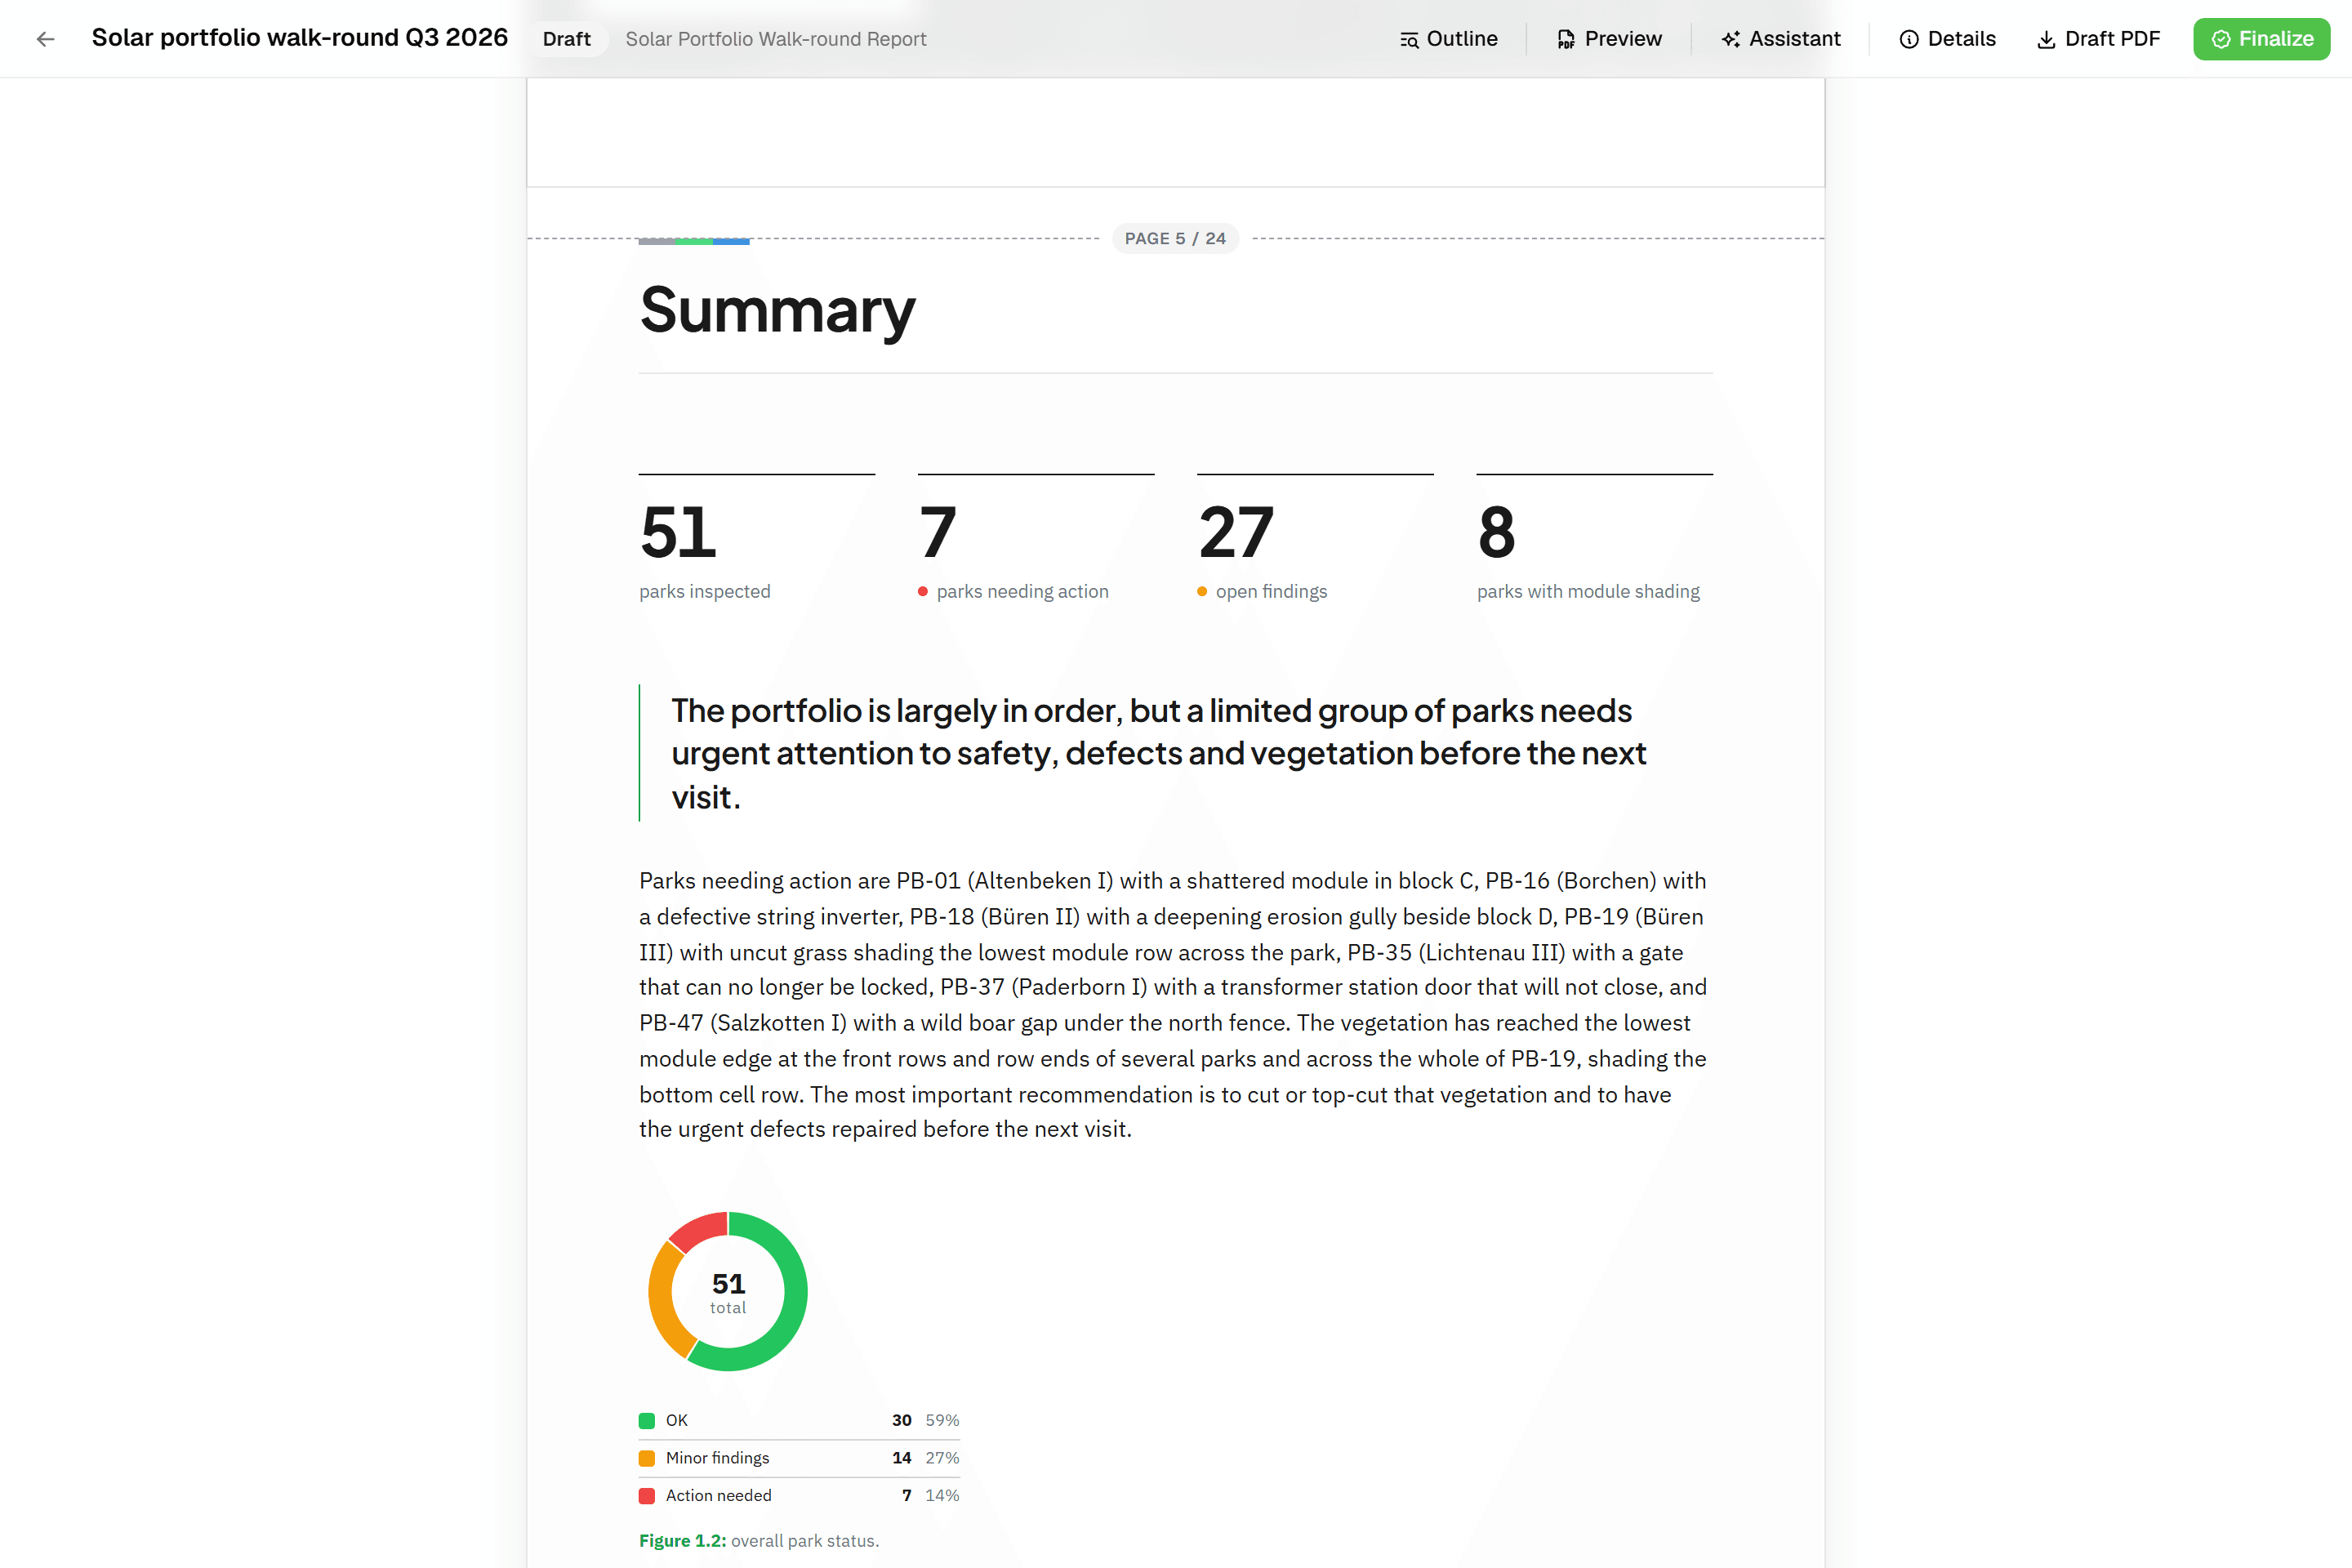
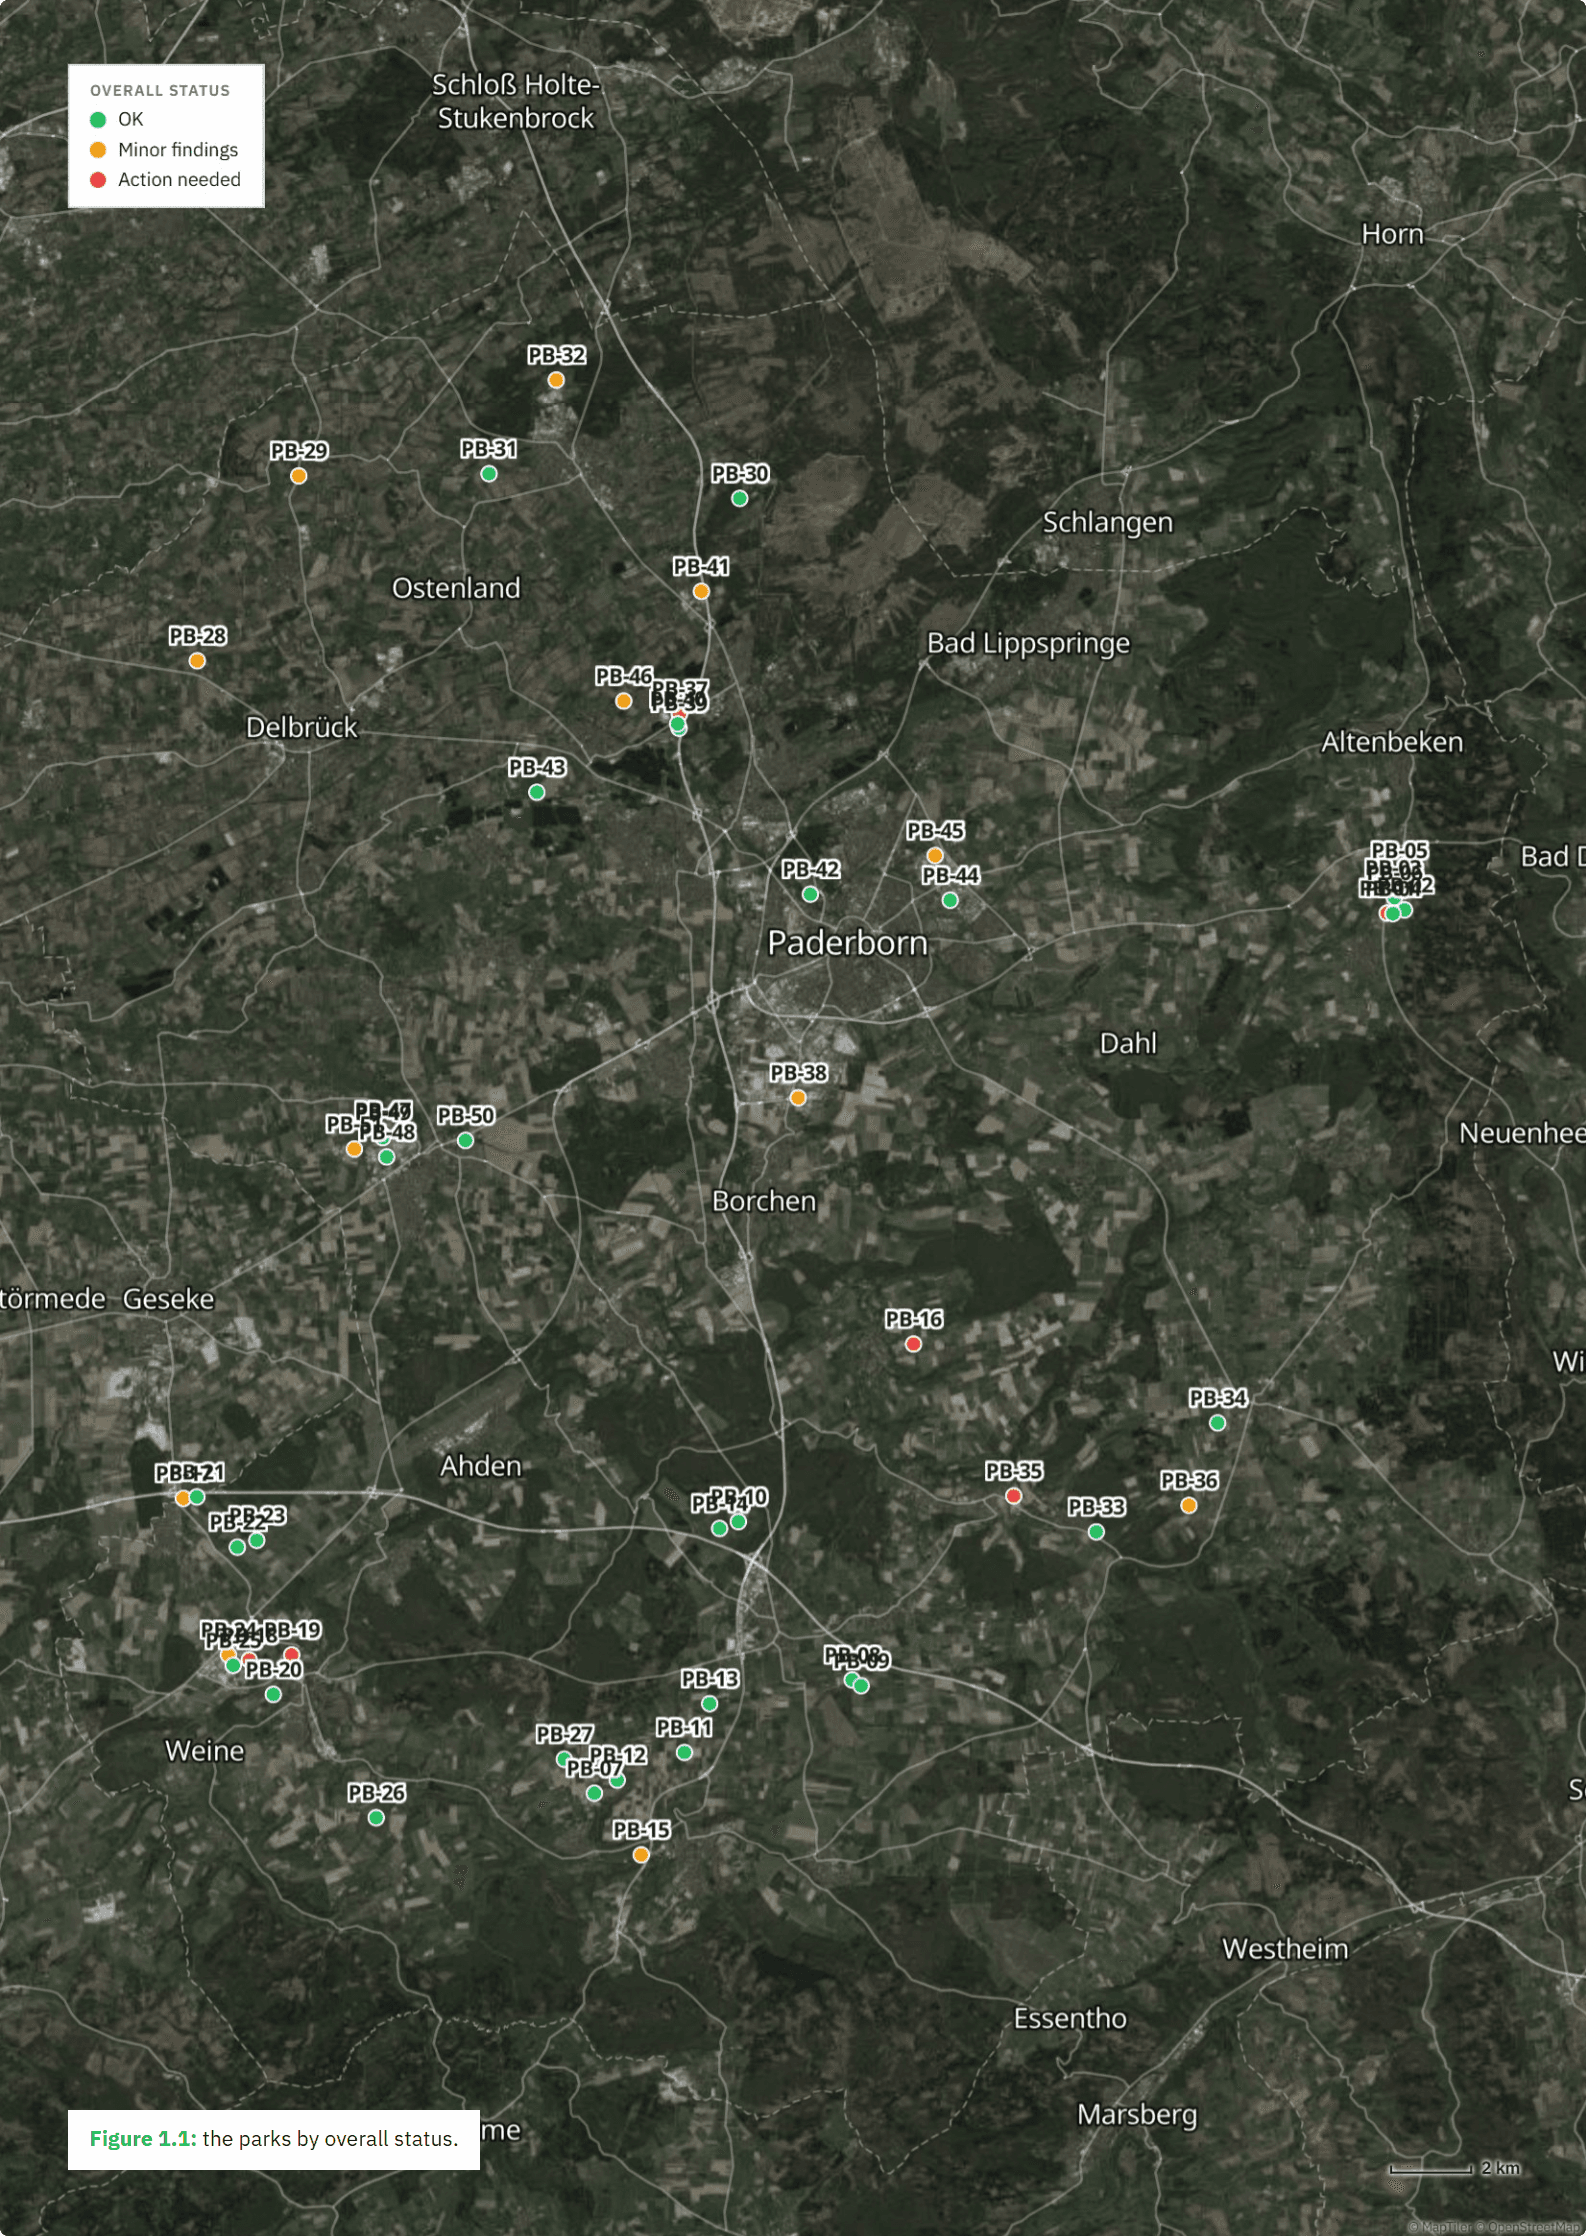
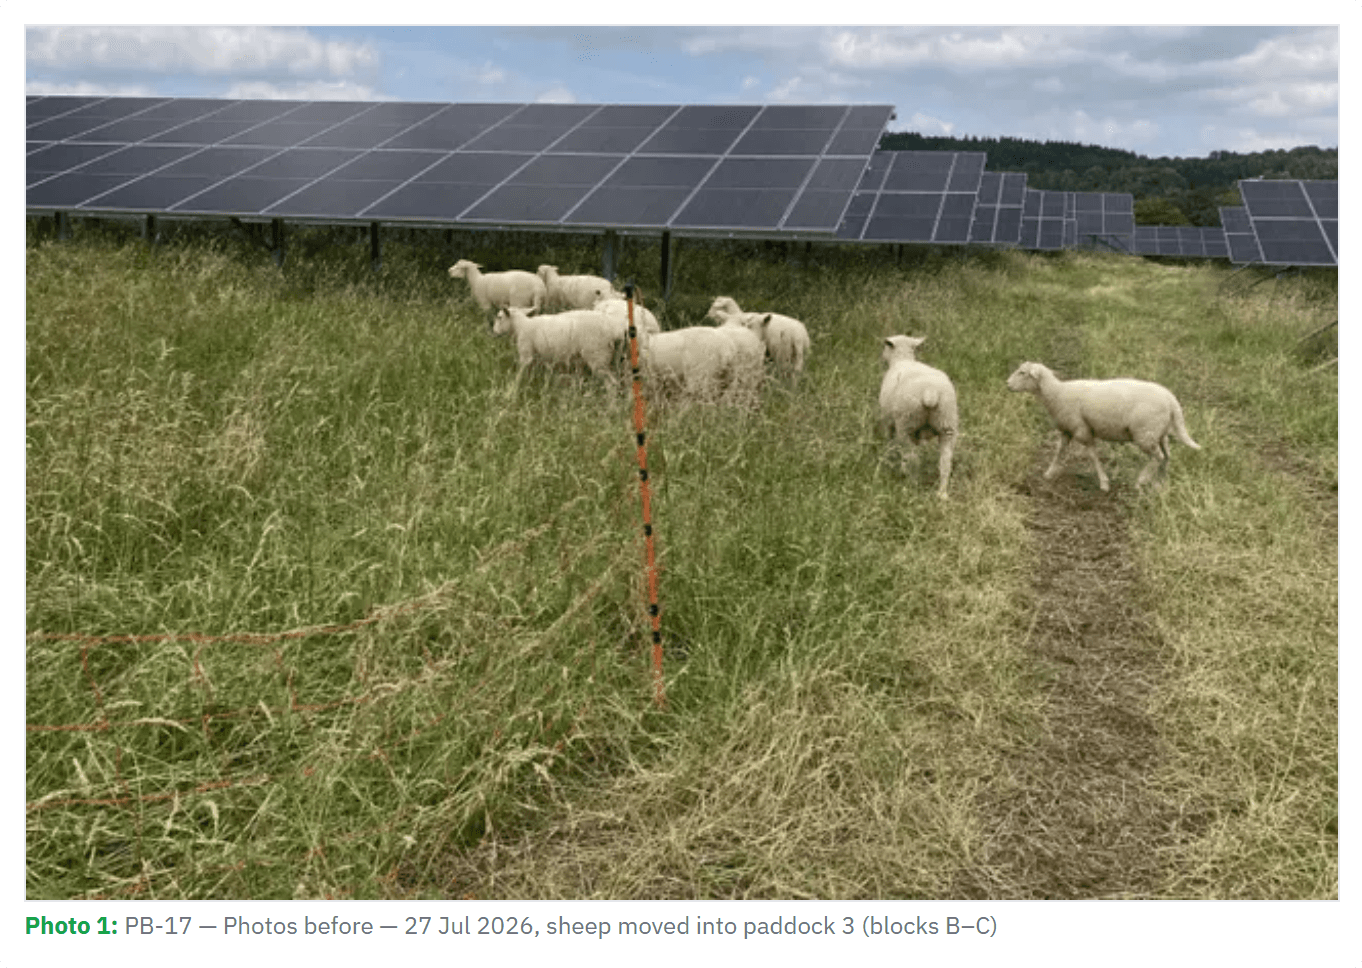
A report in Geocadra is a column of blocks (text, tables, photo appendices, map figures) that pull from the project's latest inspection data when they render. A live PDF preview shows the real document while you edit, an AI assistant writes text and configures blocks from the data, and 'Finalize' freezes the report as an immutable PDF with a data snapshot. Templates are set up per workspace together with us.
The problem
The challenge with reports written beside the data
Writing the report is where a field job stalls. Numbers are copied from a spreadsheet into Word, photos are cropped and pasted one by one, the table of contents is fixed by hand at the end. When a re-inspection changes a value, every table and figure has to be checked again. The report becomes a second, separate version of the data.
The solution
Blocks that render from the inspection data
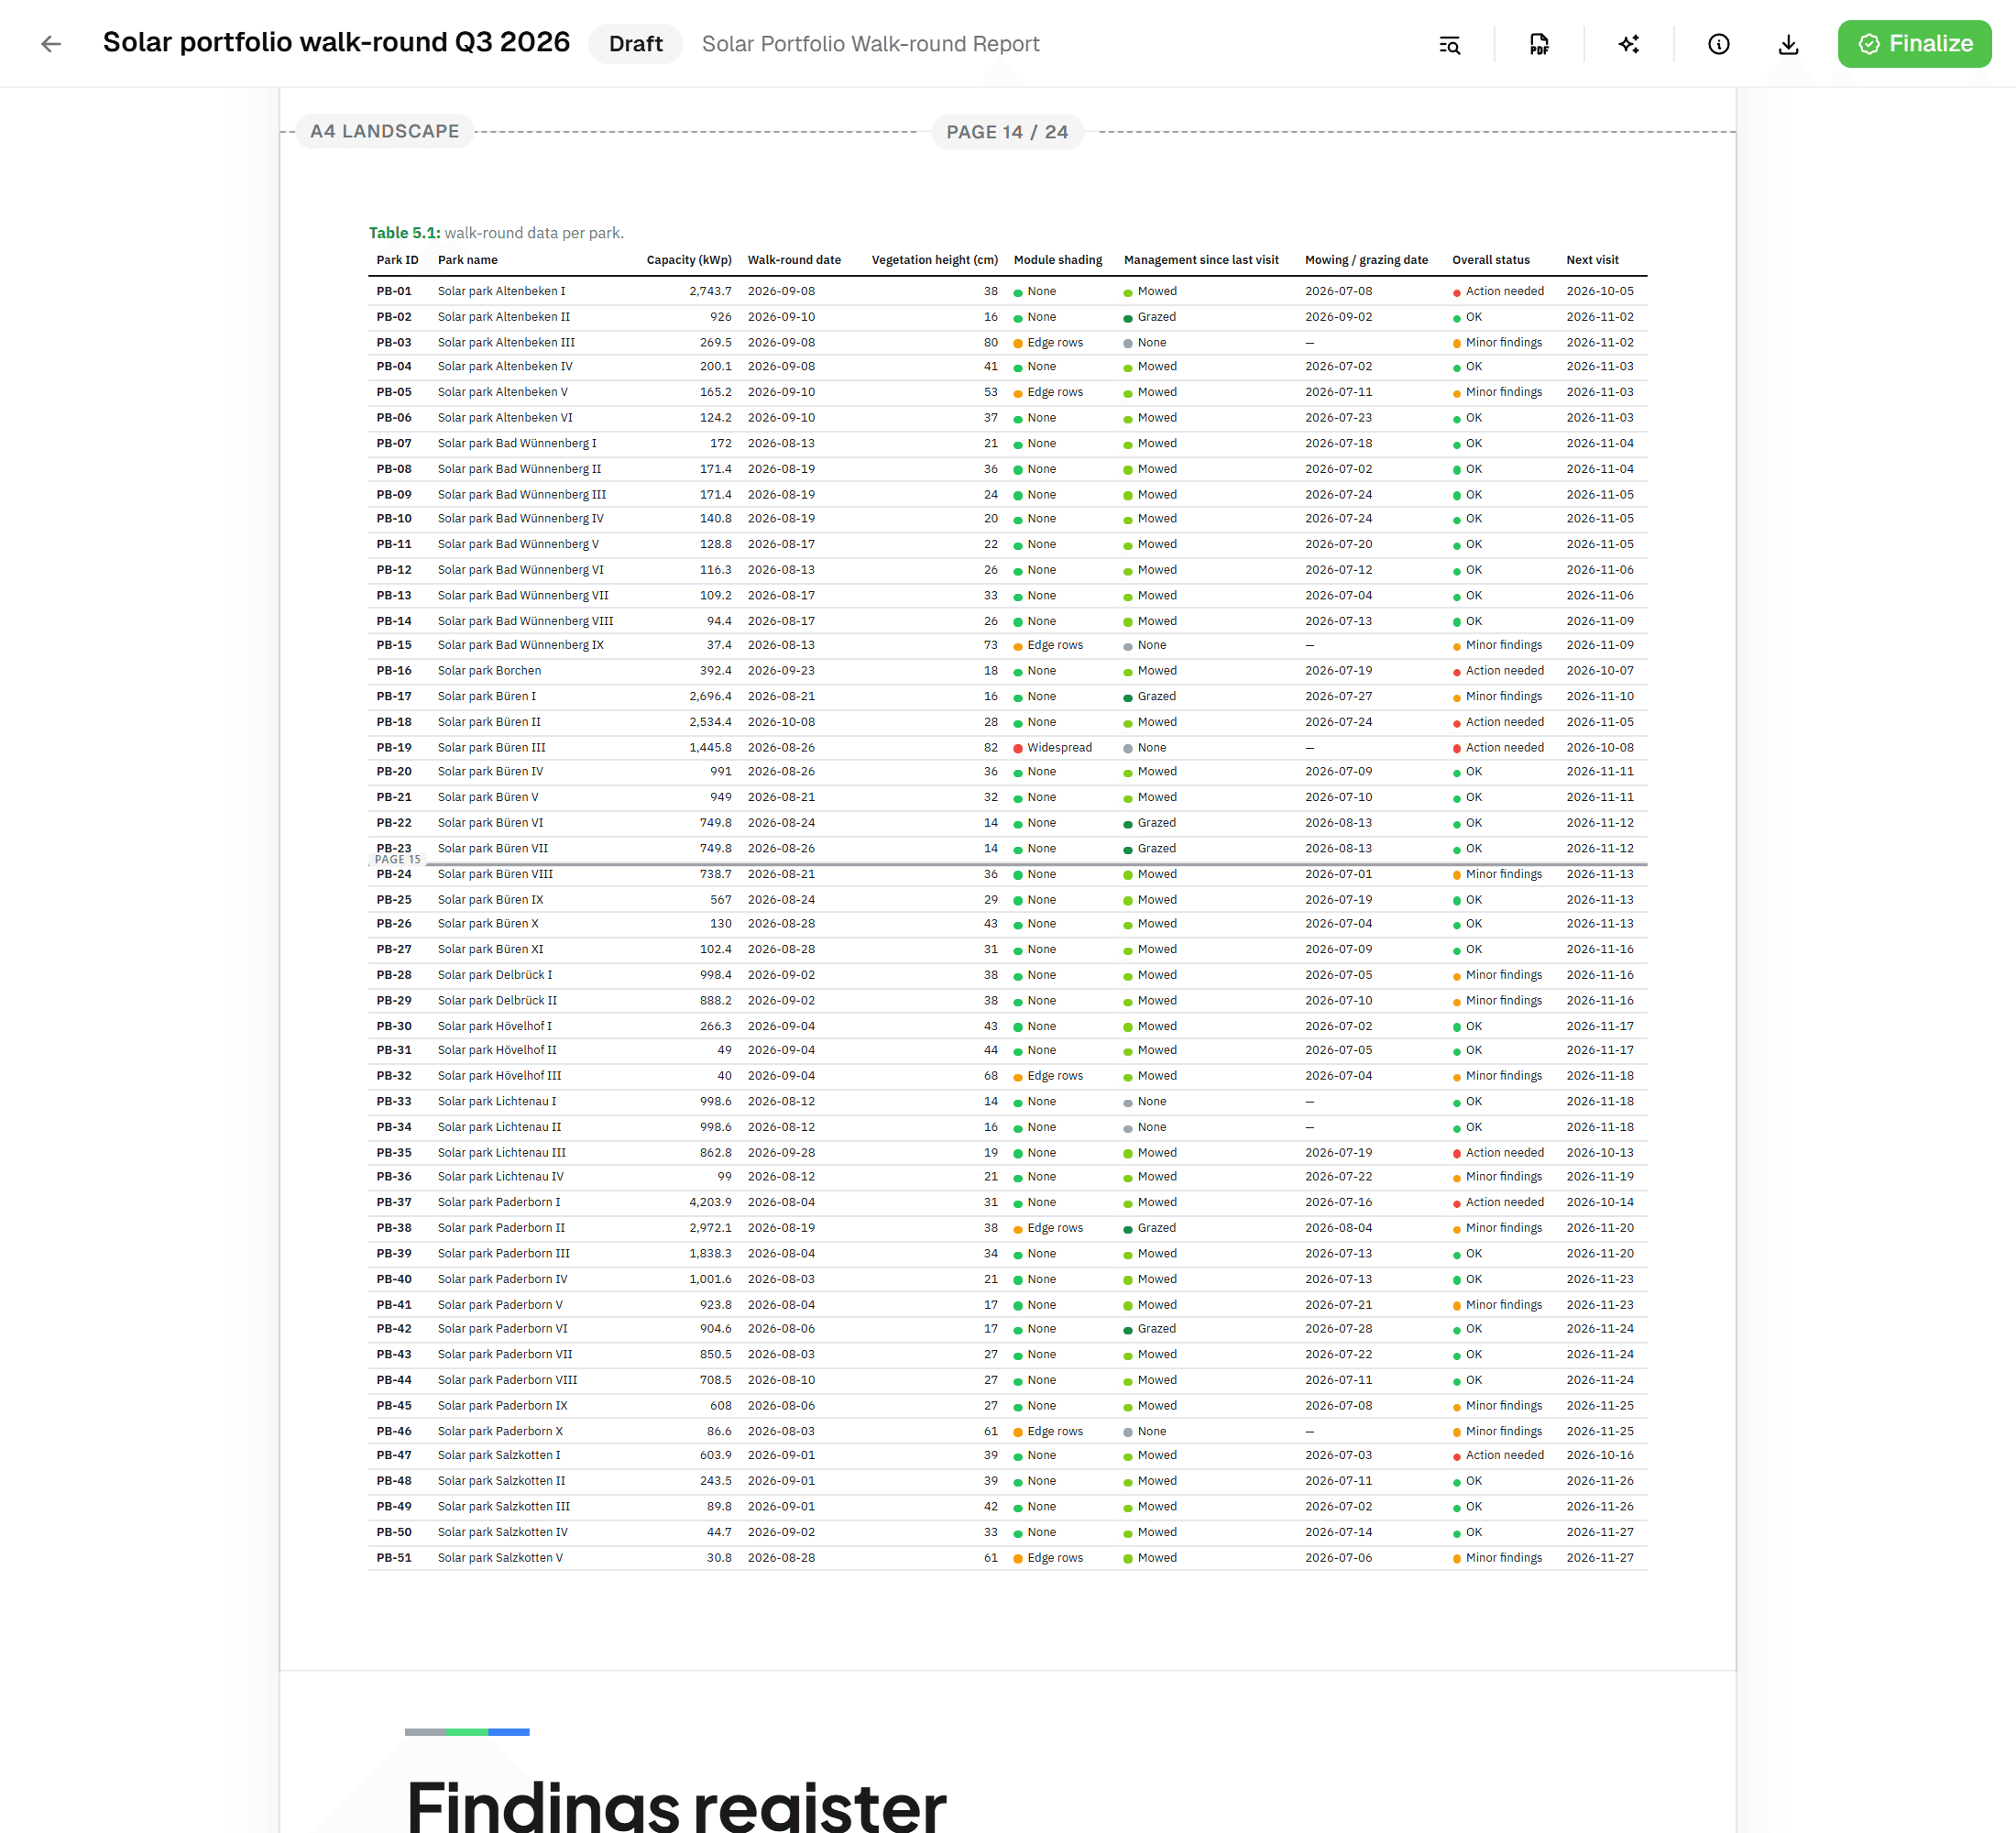
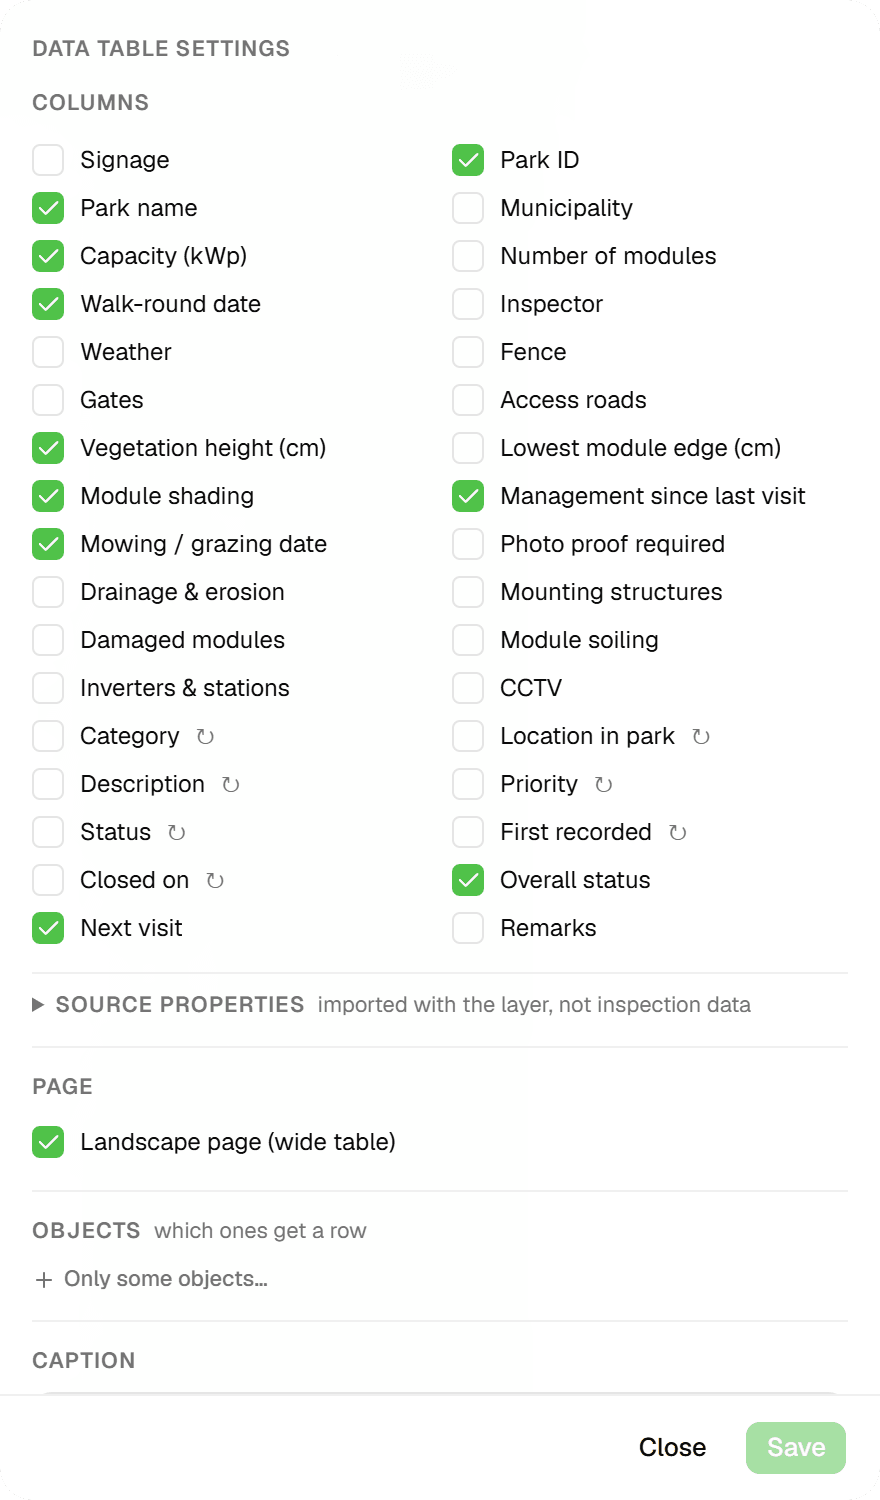
In Geocadra the report is bound to the data. A data-table block lists the form fields you choose from the latest inspection per feature, a field-distribution block counts values, a photo-appendix block builds the photo appendix from the image fields and a map-figure block renders a map sheet from the current geometry. Chapters, figures, tables and appendices are numbered by the renderer, and your workspace's brand kit (fonts, colours, banners, logo) styles every page.

Key benefits
- Tables and photo appendices pull live field data
- Live PDF preview of the real document
- AI assistant that writes from the inspection data
- Finalize to an immutable PDF with a data snapshot
- Map figures from A4 to A0 inside the report
- Revisions labelled rev. B, rev. C and so on
How It Works
- 01
Start from a workspace template
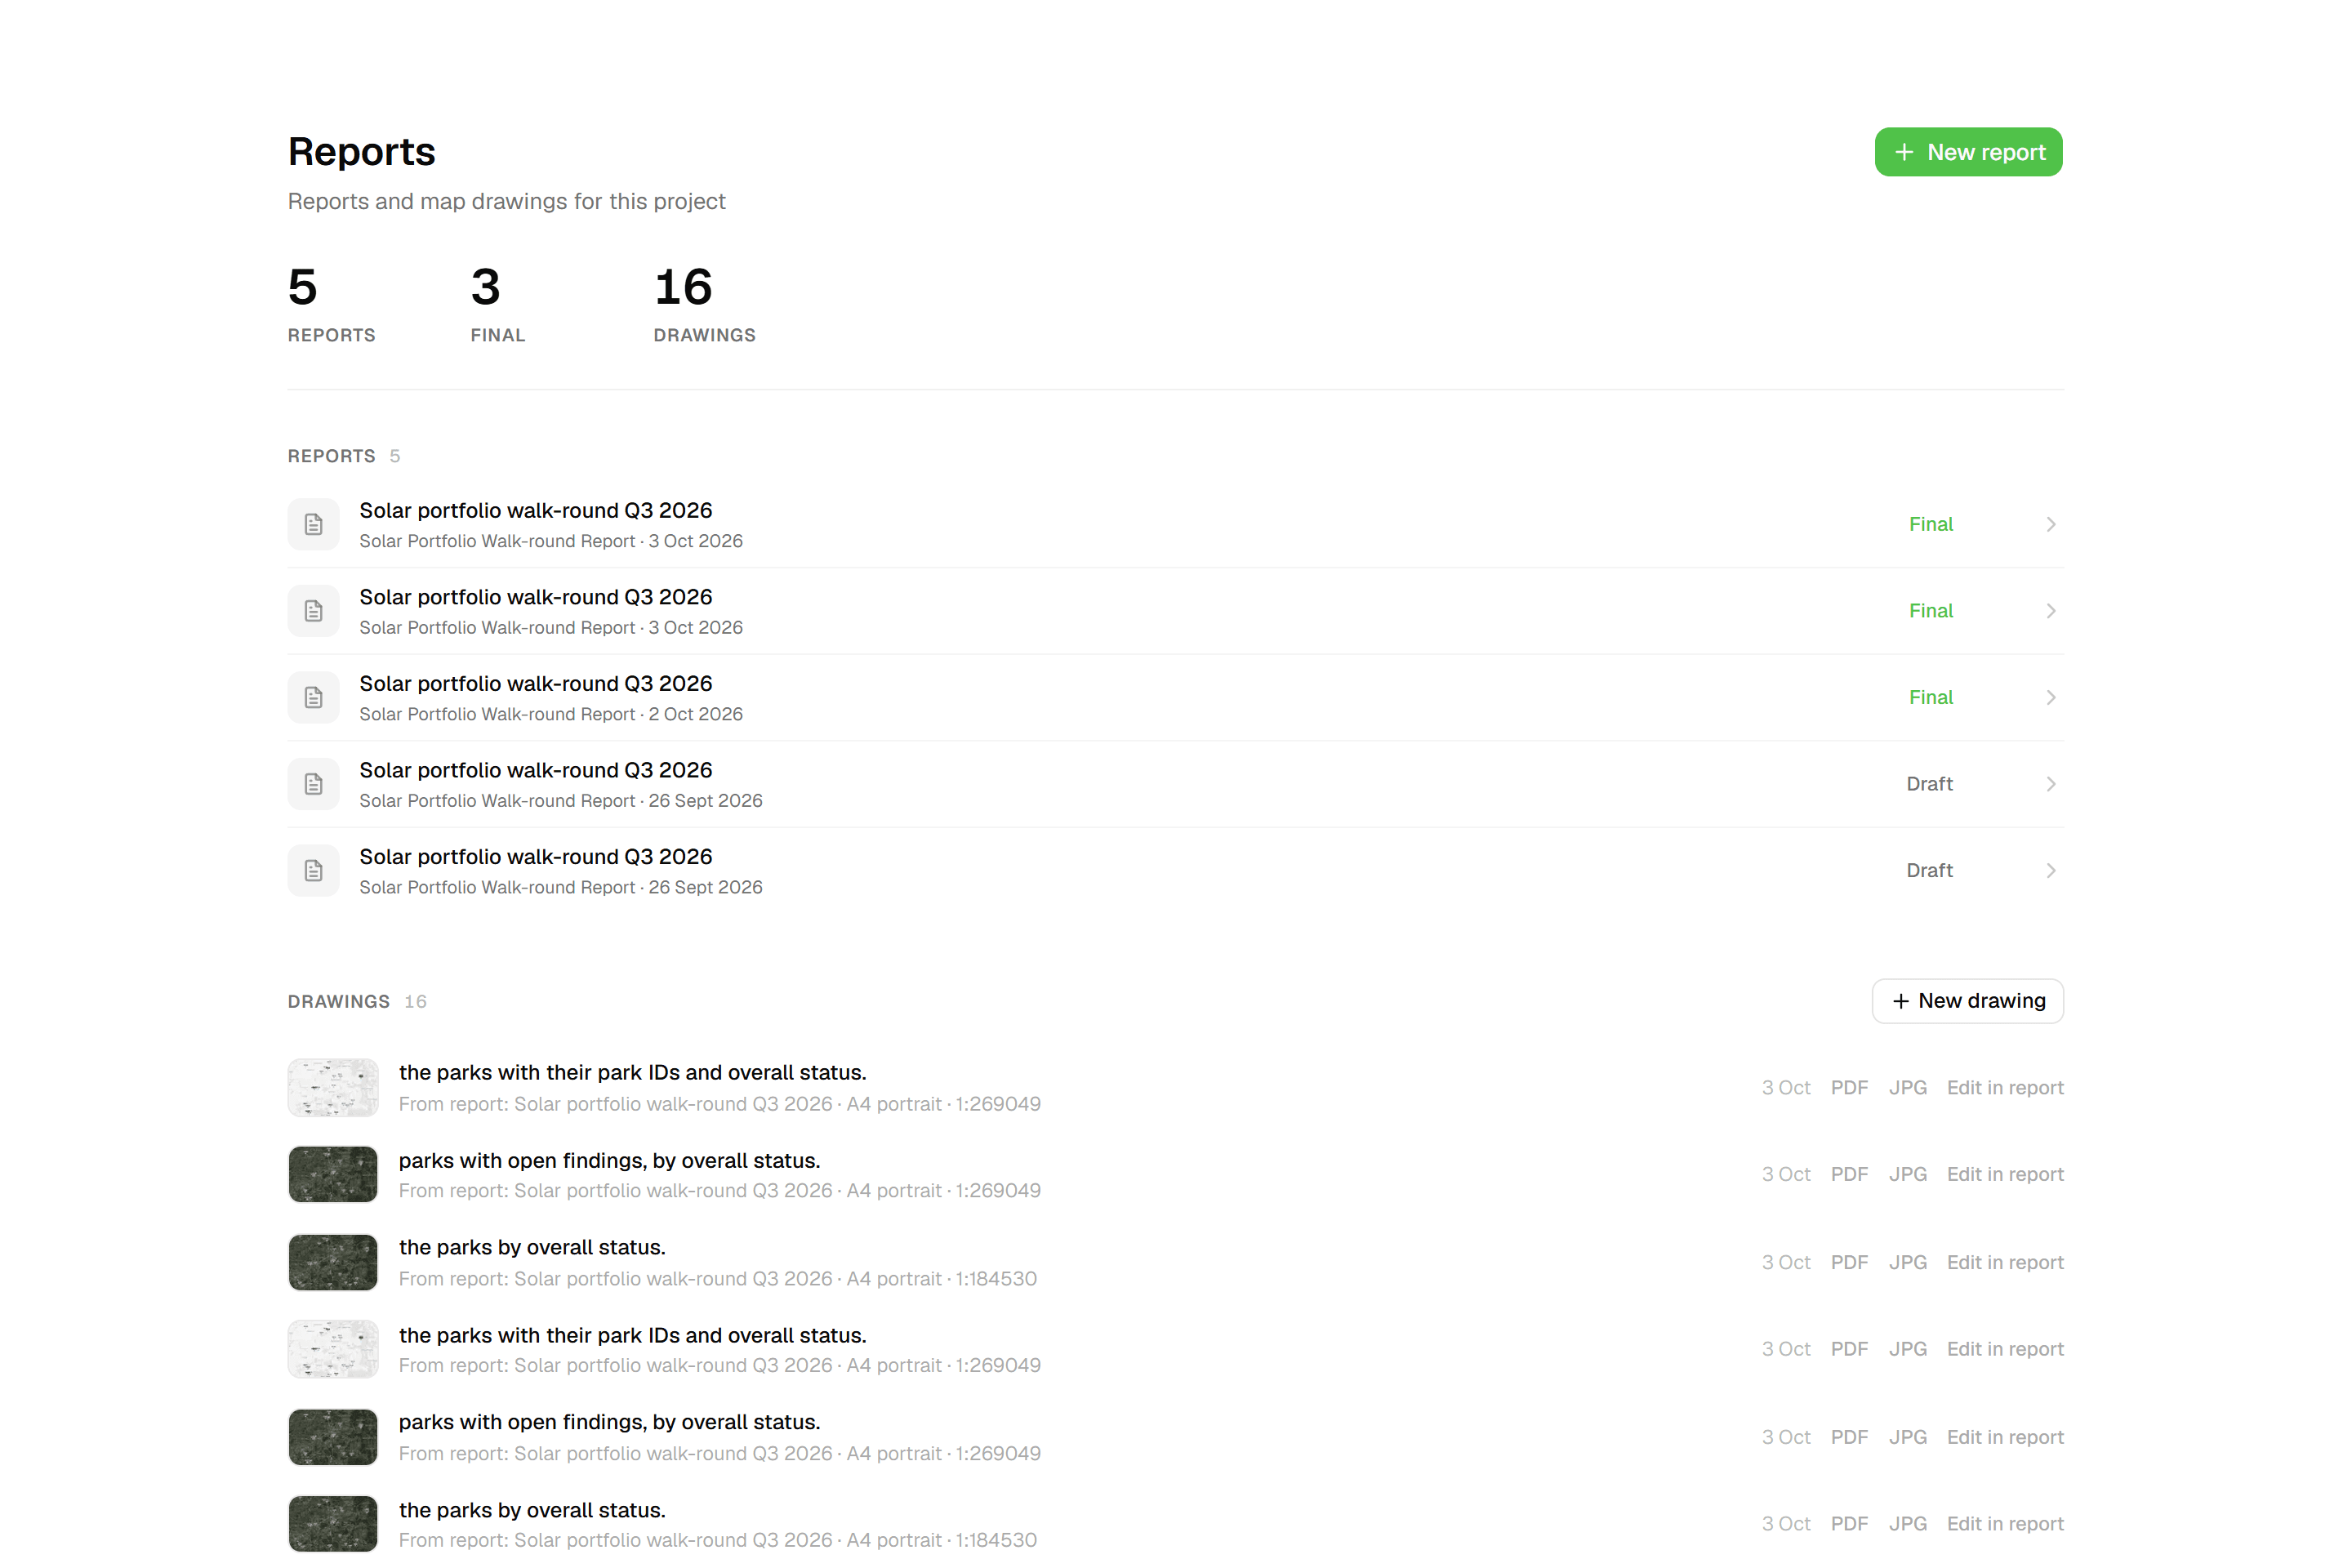
Click 'New report' in the project's Reports hub and pick one of your workspace's templates, each shown with a cover thumbnail and block count. Fill in the template's context fields (project number, client, adviser, location) or upload project documents (PDF, TXT, Markdown, JPEG, PNG, up to 50 MB each) and let 'Fill with AI' pre-fill them, marked 'AI' for your review.
- 02
Build with blocks and the AI assistant
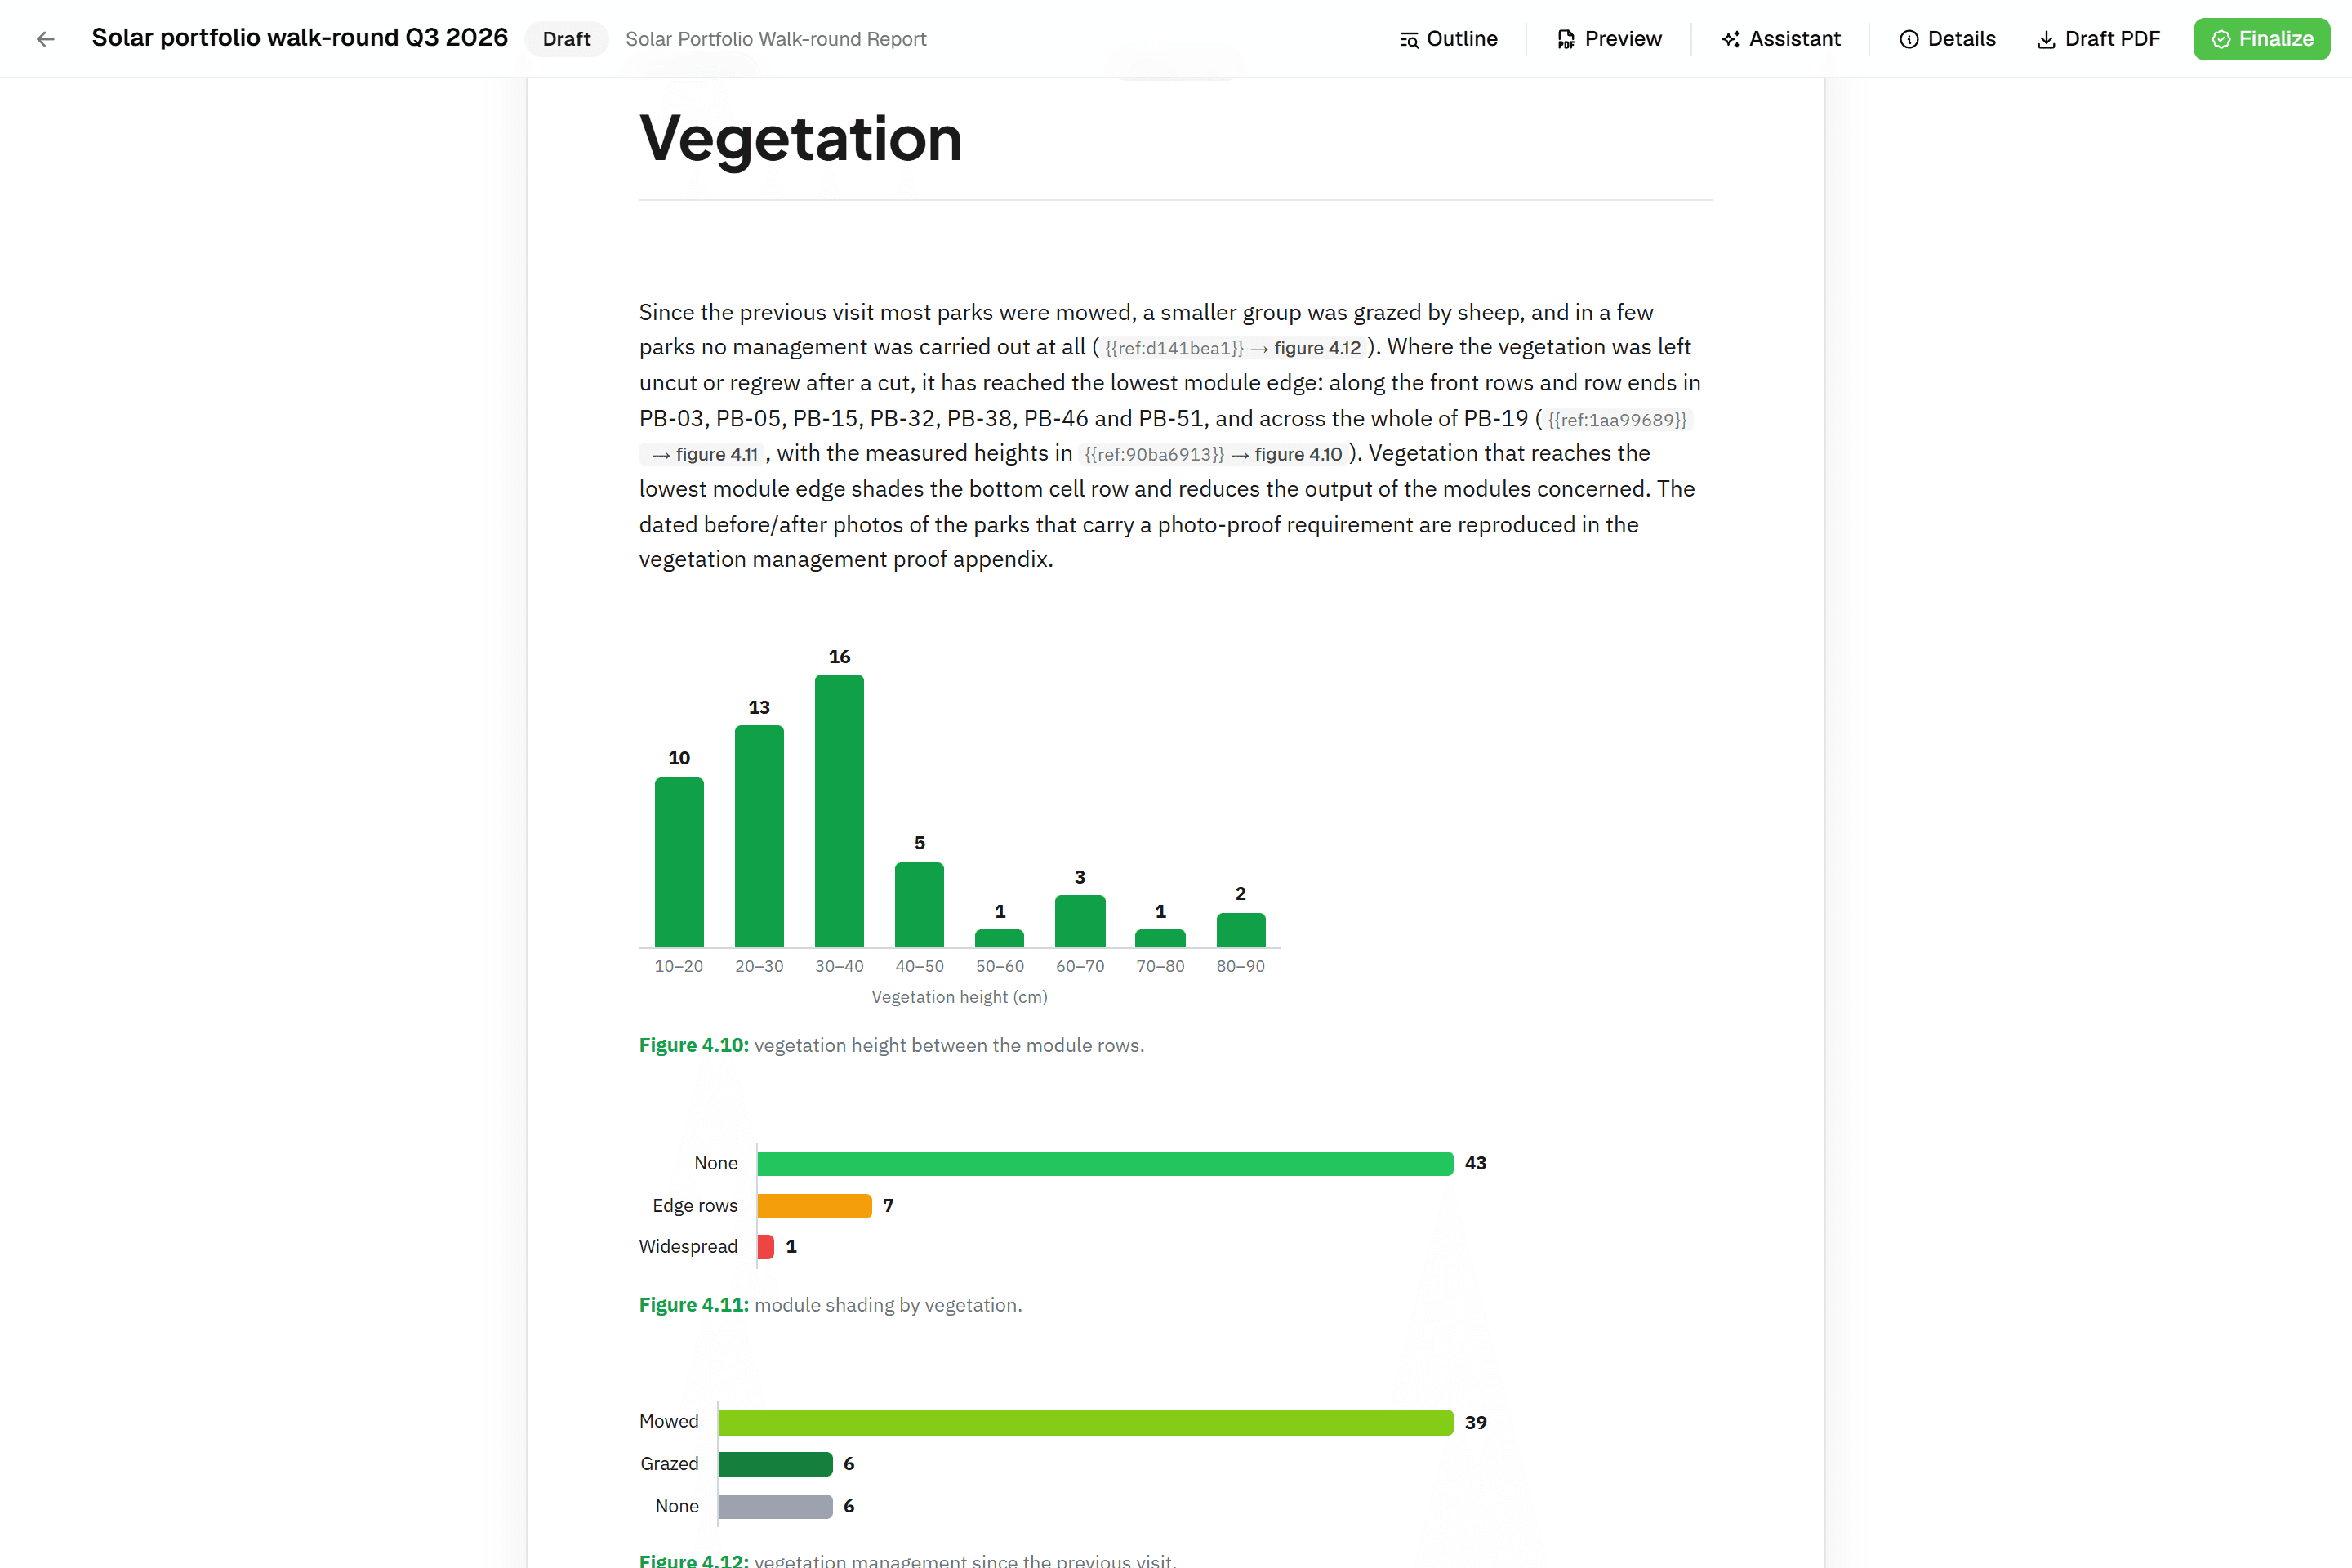
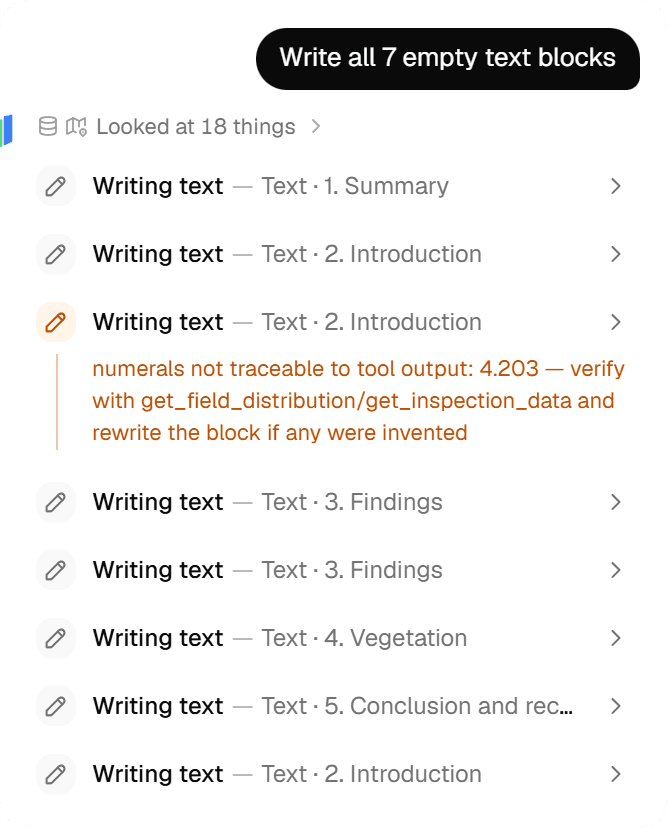
The editor is a column of 14 block types: text, subheading, chapter, data table, field distribution, photo appendix, photo selection, map figure, image, appendix header, cover, colophon, table of contents and page break. Open the chat dock and ask for a change: the assistant reads the inspections and your documents, writes text, adds and configures blocks and designs map figures. Every write shows a tool card with UNDO, and the numbers in its prose are checked against the data it has read and the context you entered; anything it cannot trace is flagged for it to verify.
- 03
Preview, finalize, revise
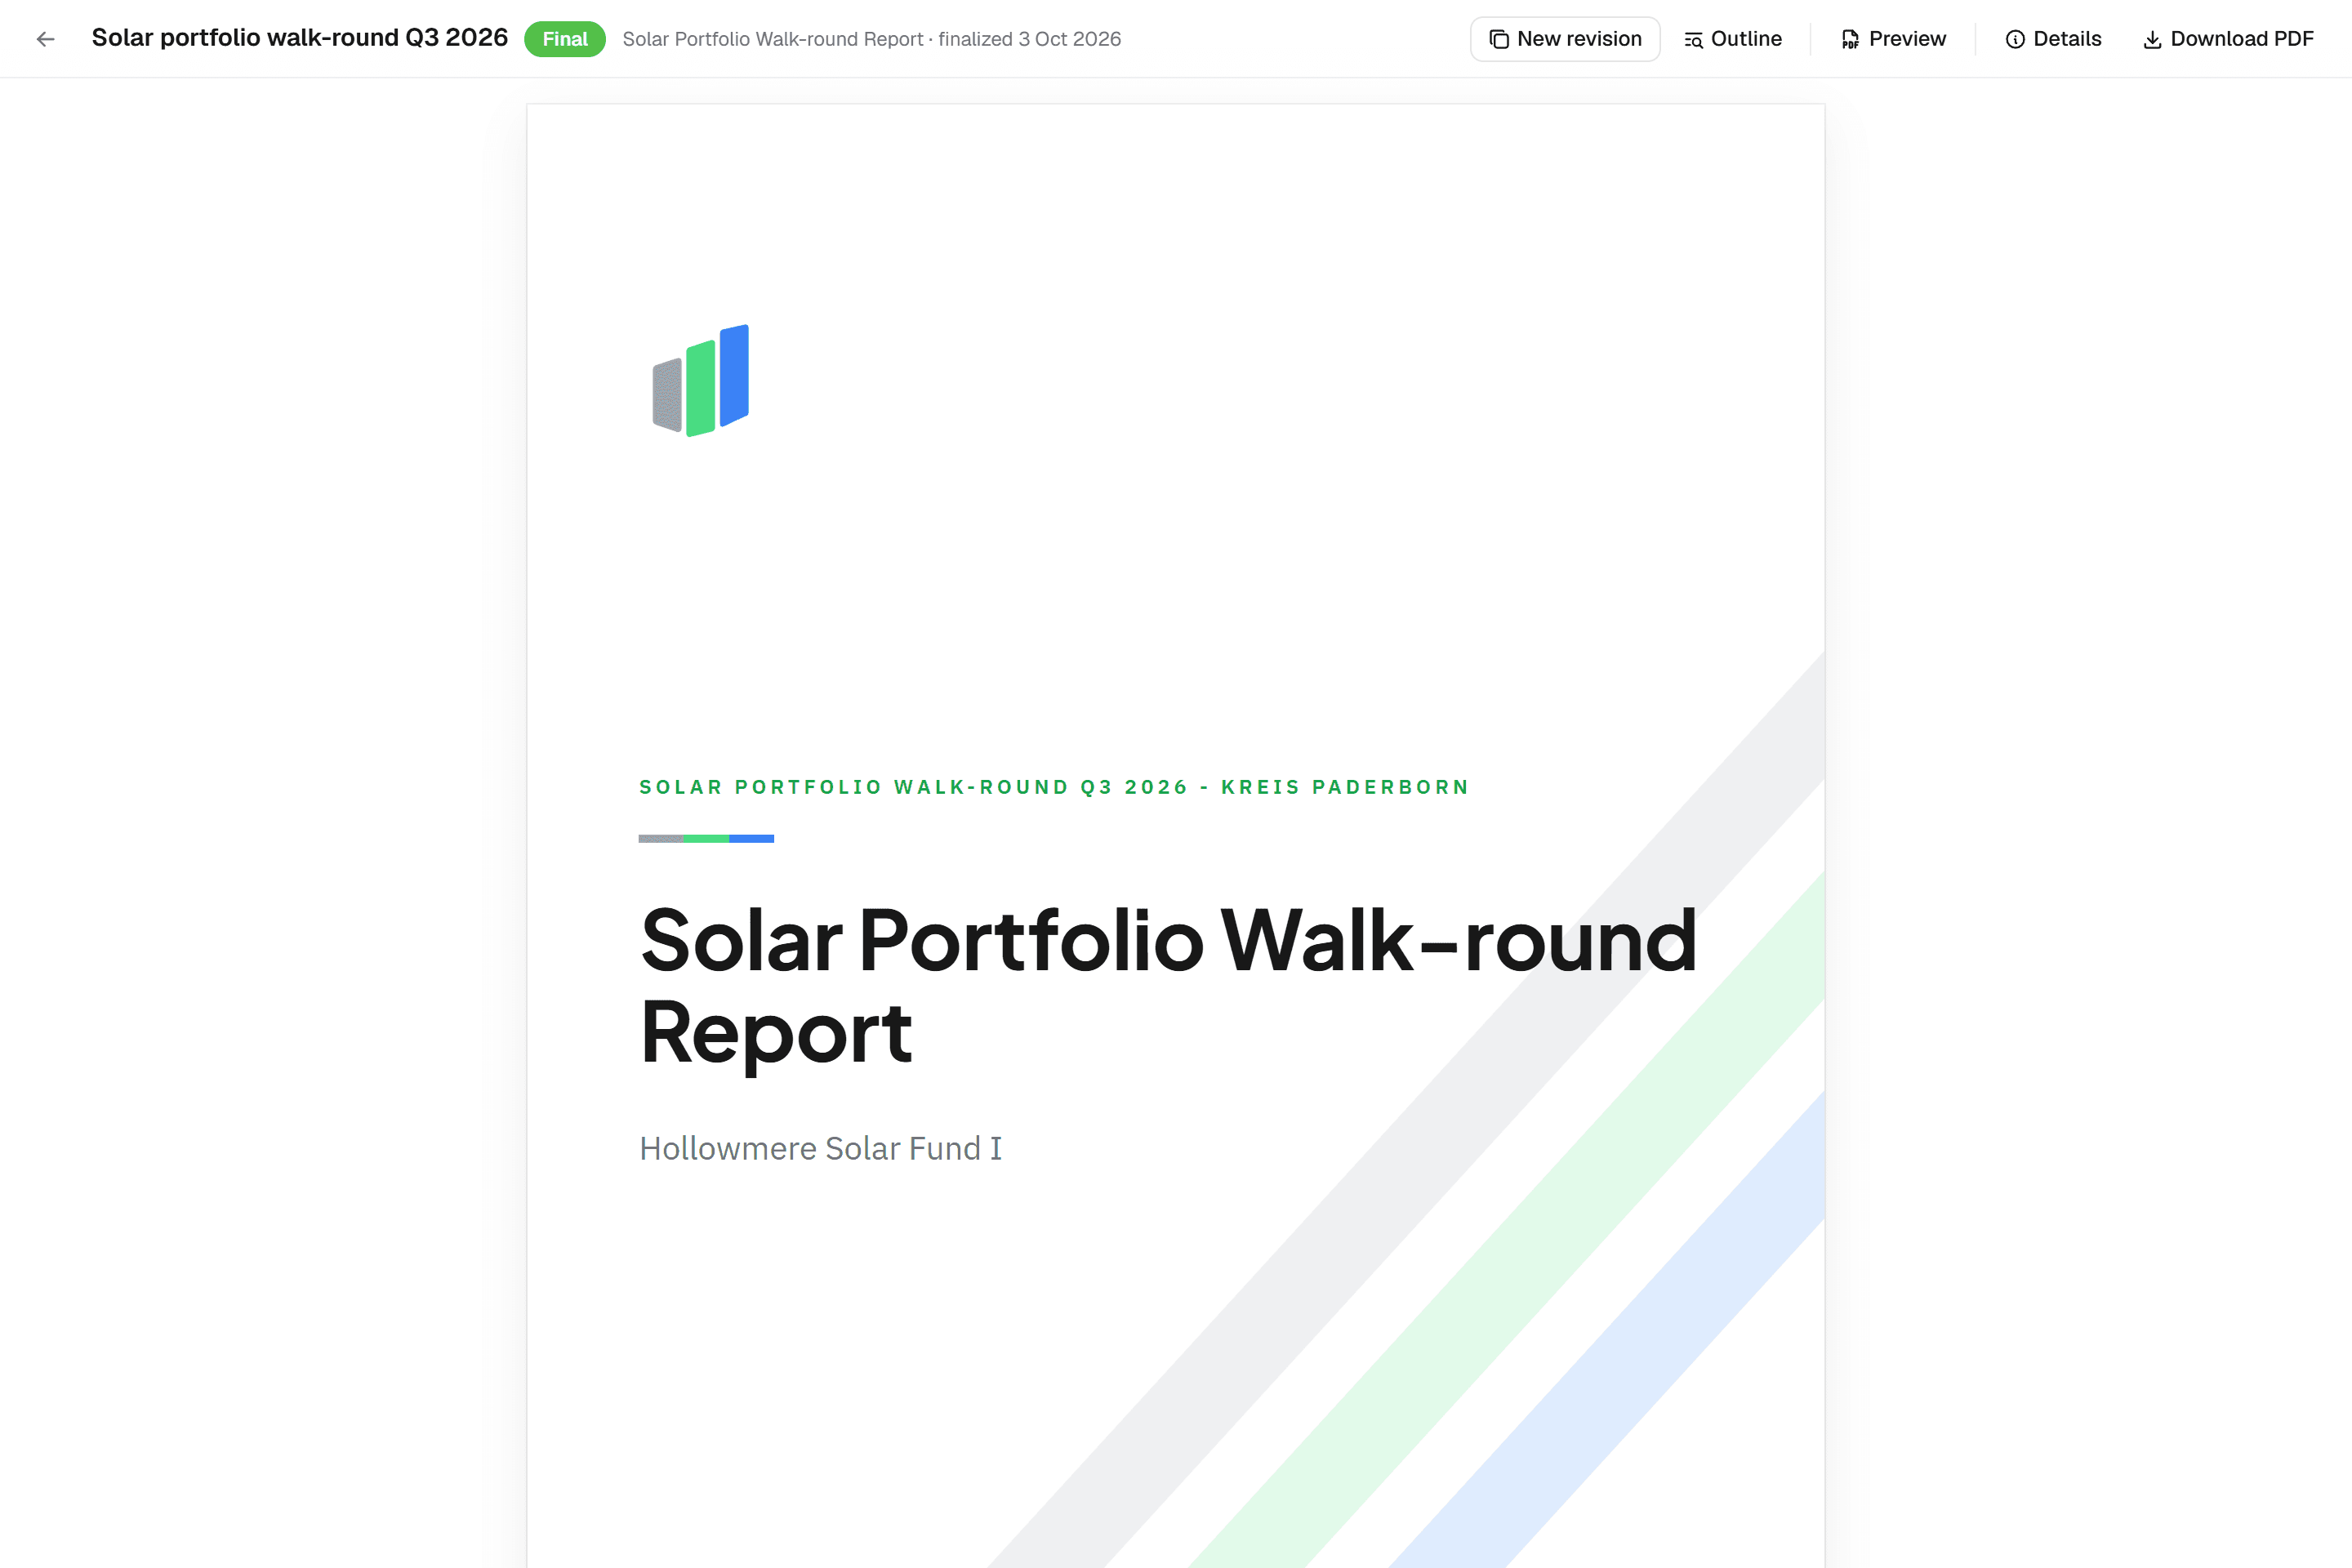
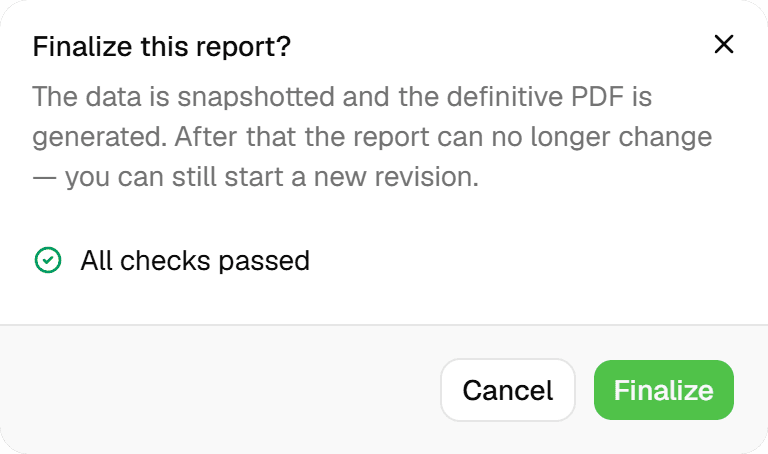
The preview pane renders the real PDF 1.5 seconds after each save; drafts carry a 'CONCEPT' watermark. 'Finalize' runs a pre-check (missing required context fields, invalid bindings, empty blocks), then freezes the report: a data snapshot plus the definitive PDF with real table-of-contents page numbers. Final reports are immutable; 'New revision' opens a new draft labelled rev. B, rev. C and so on, with earlier revisions listed beneath it.
Common Use Cases
- 01
Tree assessment reports
A BEA-style report with a data table holding one row per tree, a photo appendix with one page per tree and a map figure showing crown projections from a map style preset, all pulled from the inspections, numbered by the renderer and finalised as one PDF.
- 02
Photo appendices that never crop
A photo-appendix block lays out the image fields of each inspection in justified rows at true aspect ratio, 1 to 4 columns, flowing or one page per feature, with per-report photo exclusion. For a hand-picked selection, a photo-selection block takes up to 24 inspection photos with captions.
- 03
Map figures at drawing scale
A map-figure block renders the project layers with their map style presets, reference drawings and PDOK underlays at a fixed standard scale or auto-fit, on A4 up to A0, portrait or landscape, inserted into the A4 report. Focus on specific tree numbers; the extent follows the current geometry at render time.
- 04
Standalone map sheets
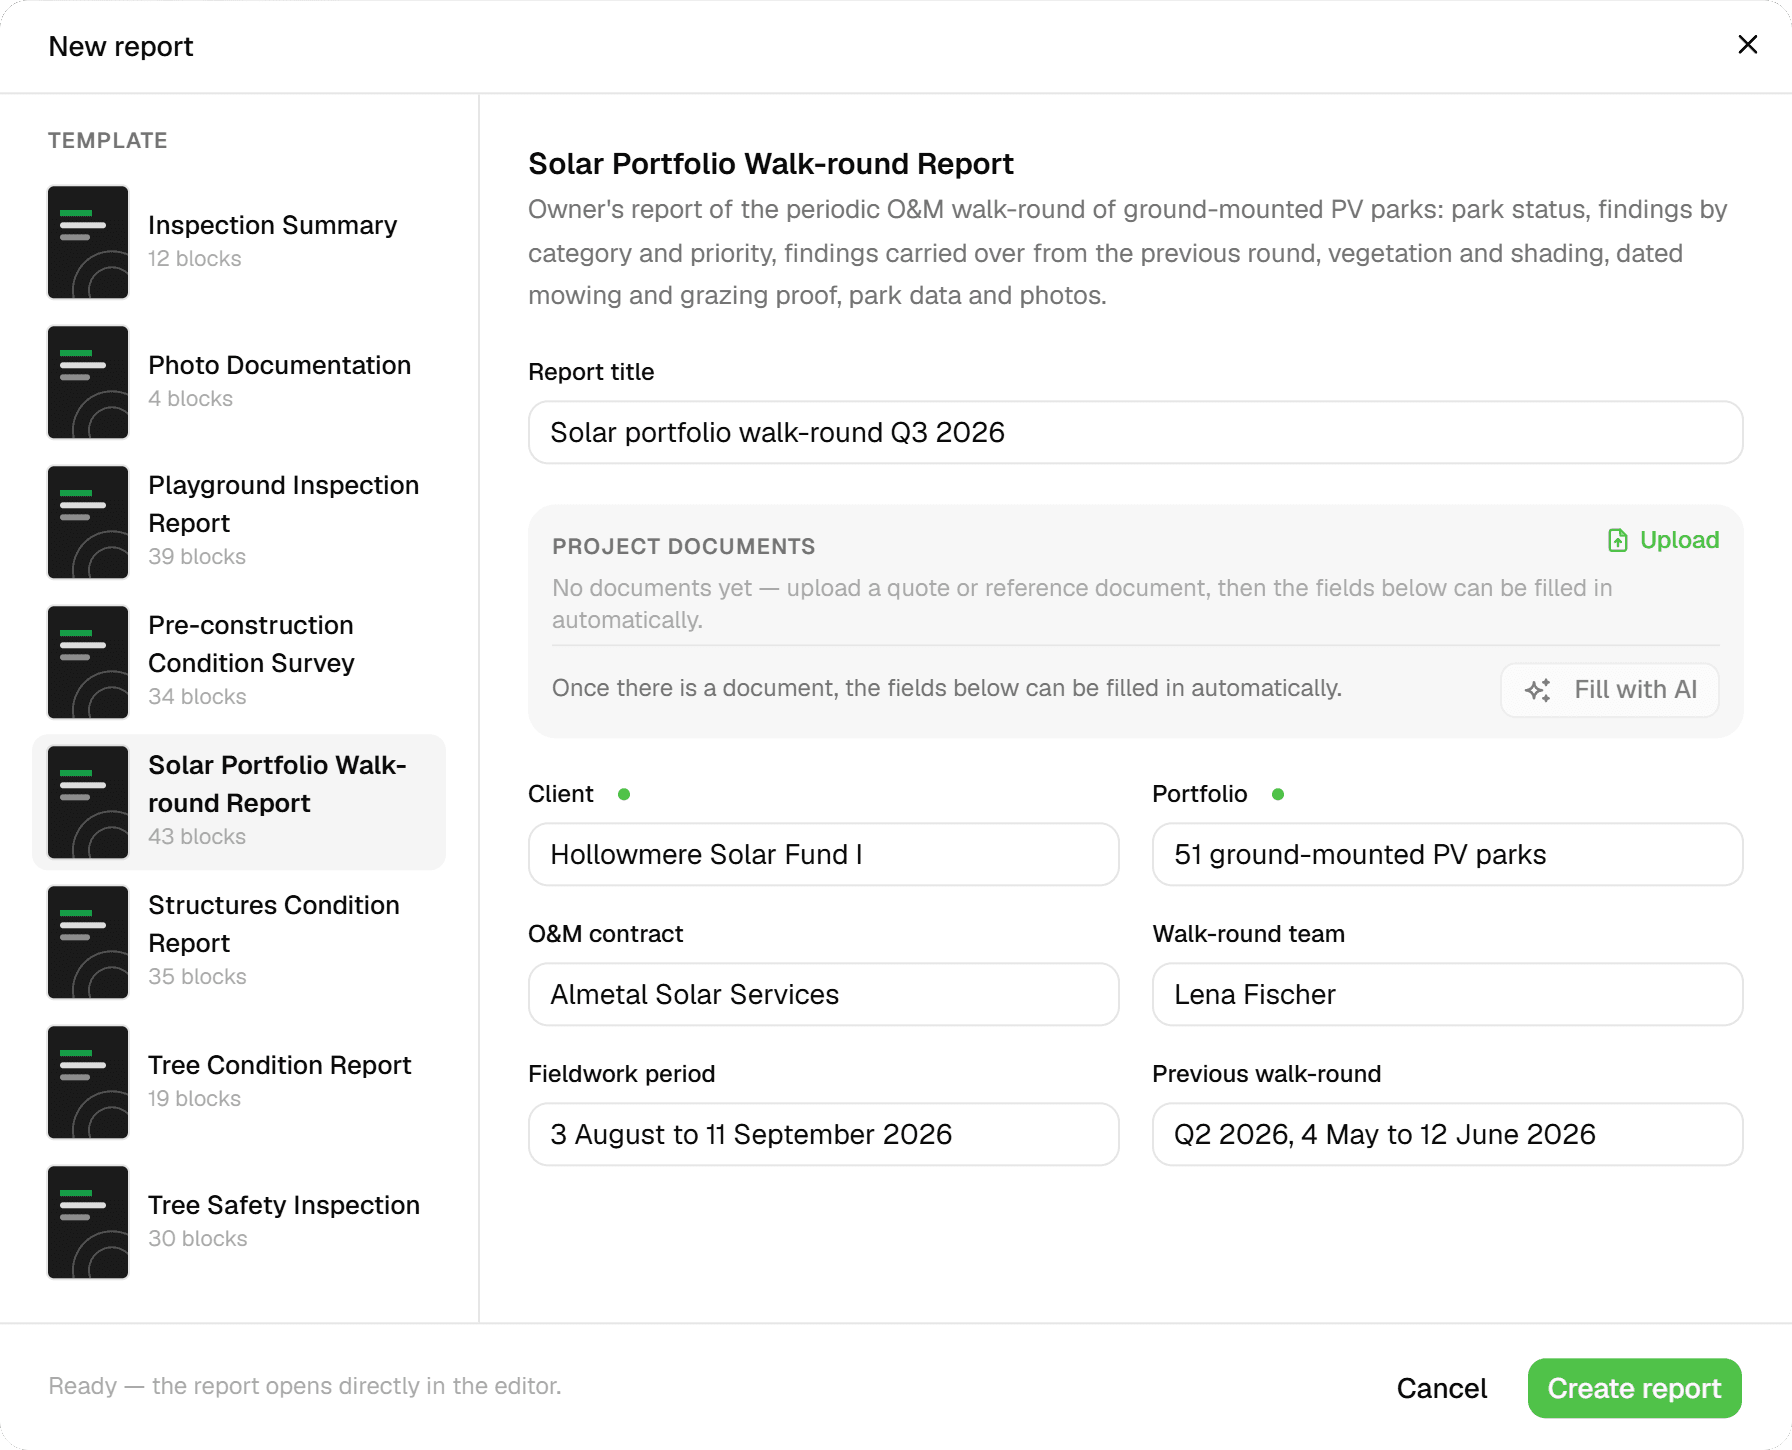
From the same Reports hub, export a drawing as PDF or JPG with north arrow, scale bar and a title block holding title, project, date, scale, legend and your logo. Standard scales from 1:100 to 1:10,000, paper Auto or A4 to A0, with a draw-a-rectangle extent picker and a history of the 25 most recent drawings.
Frequently Asked Questions
Can I build my own templates?
Templates are set up per workspace together with us, based on your house style, and carry your brand kit: heading and body fonts, five colours, cover and chapter banners and your logo. Inside a report you can add, move, configure and delete any block. The 'Made with Geocadra' credit line on covers and title blocks can be switched off for your workspace on request.
What does the AI assistant actually do?
It works inside the report with tools: it reads the report, the project summary, the form schema, field distributions, inspection data, photos and your uploaded documents, writes text blocks, adds, configures, moves and deletes blocks, and creates map style presets for figures. It writes in a business-like, factual third person, only while the report is a draft, and every write can be undone from its tool card. One conversation per report is kept.
How is the PDF produced?
The renderer lays the document out twice: a first pass finds where every heading lands, then the final pass prints the PDF with real table-of-contents page numbers. If the two passes disagree, the render fails with an error rather than shipping wrong numbers. Theme fonts are embedded so output is deterministic, photos are inlined at a 1400 px print cap, and draft downloads carry a 'CONCEPT' watermark.
Who can view, edit and download reports?
Project viewers can open the preview and download PDFs. Editing blocks, using the AI assistant, finalizing and creating revisions require the project Editor role or higher. Reports and the AI assistant are available on every plan.
What happens when a figure fails to render?
The finalize fails. A map figure that cannot render, a missing image file or an unresolved cross-reference sets the report to 'Finalize failed' with the error instead of printing a placeholder into the definitive PDF. Figures are re-rendered fresh at finalize, so the final document reflects the field data at that moment.
Explore More Features
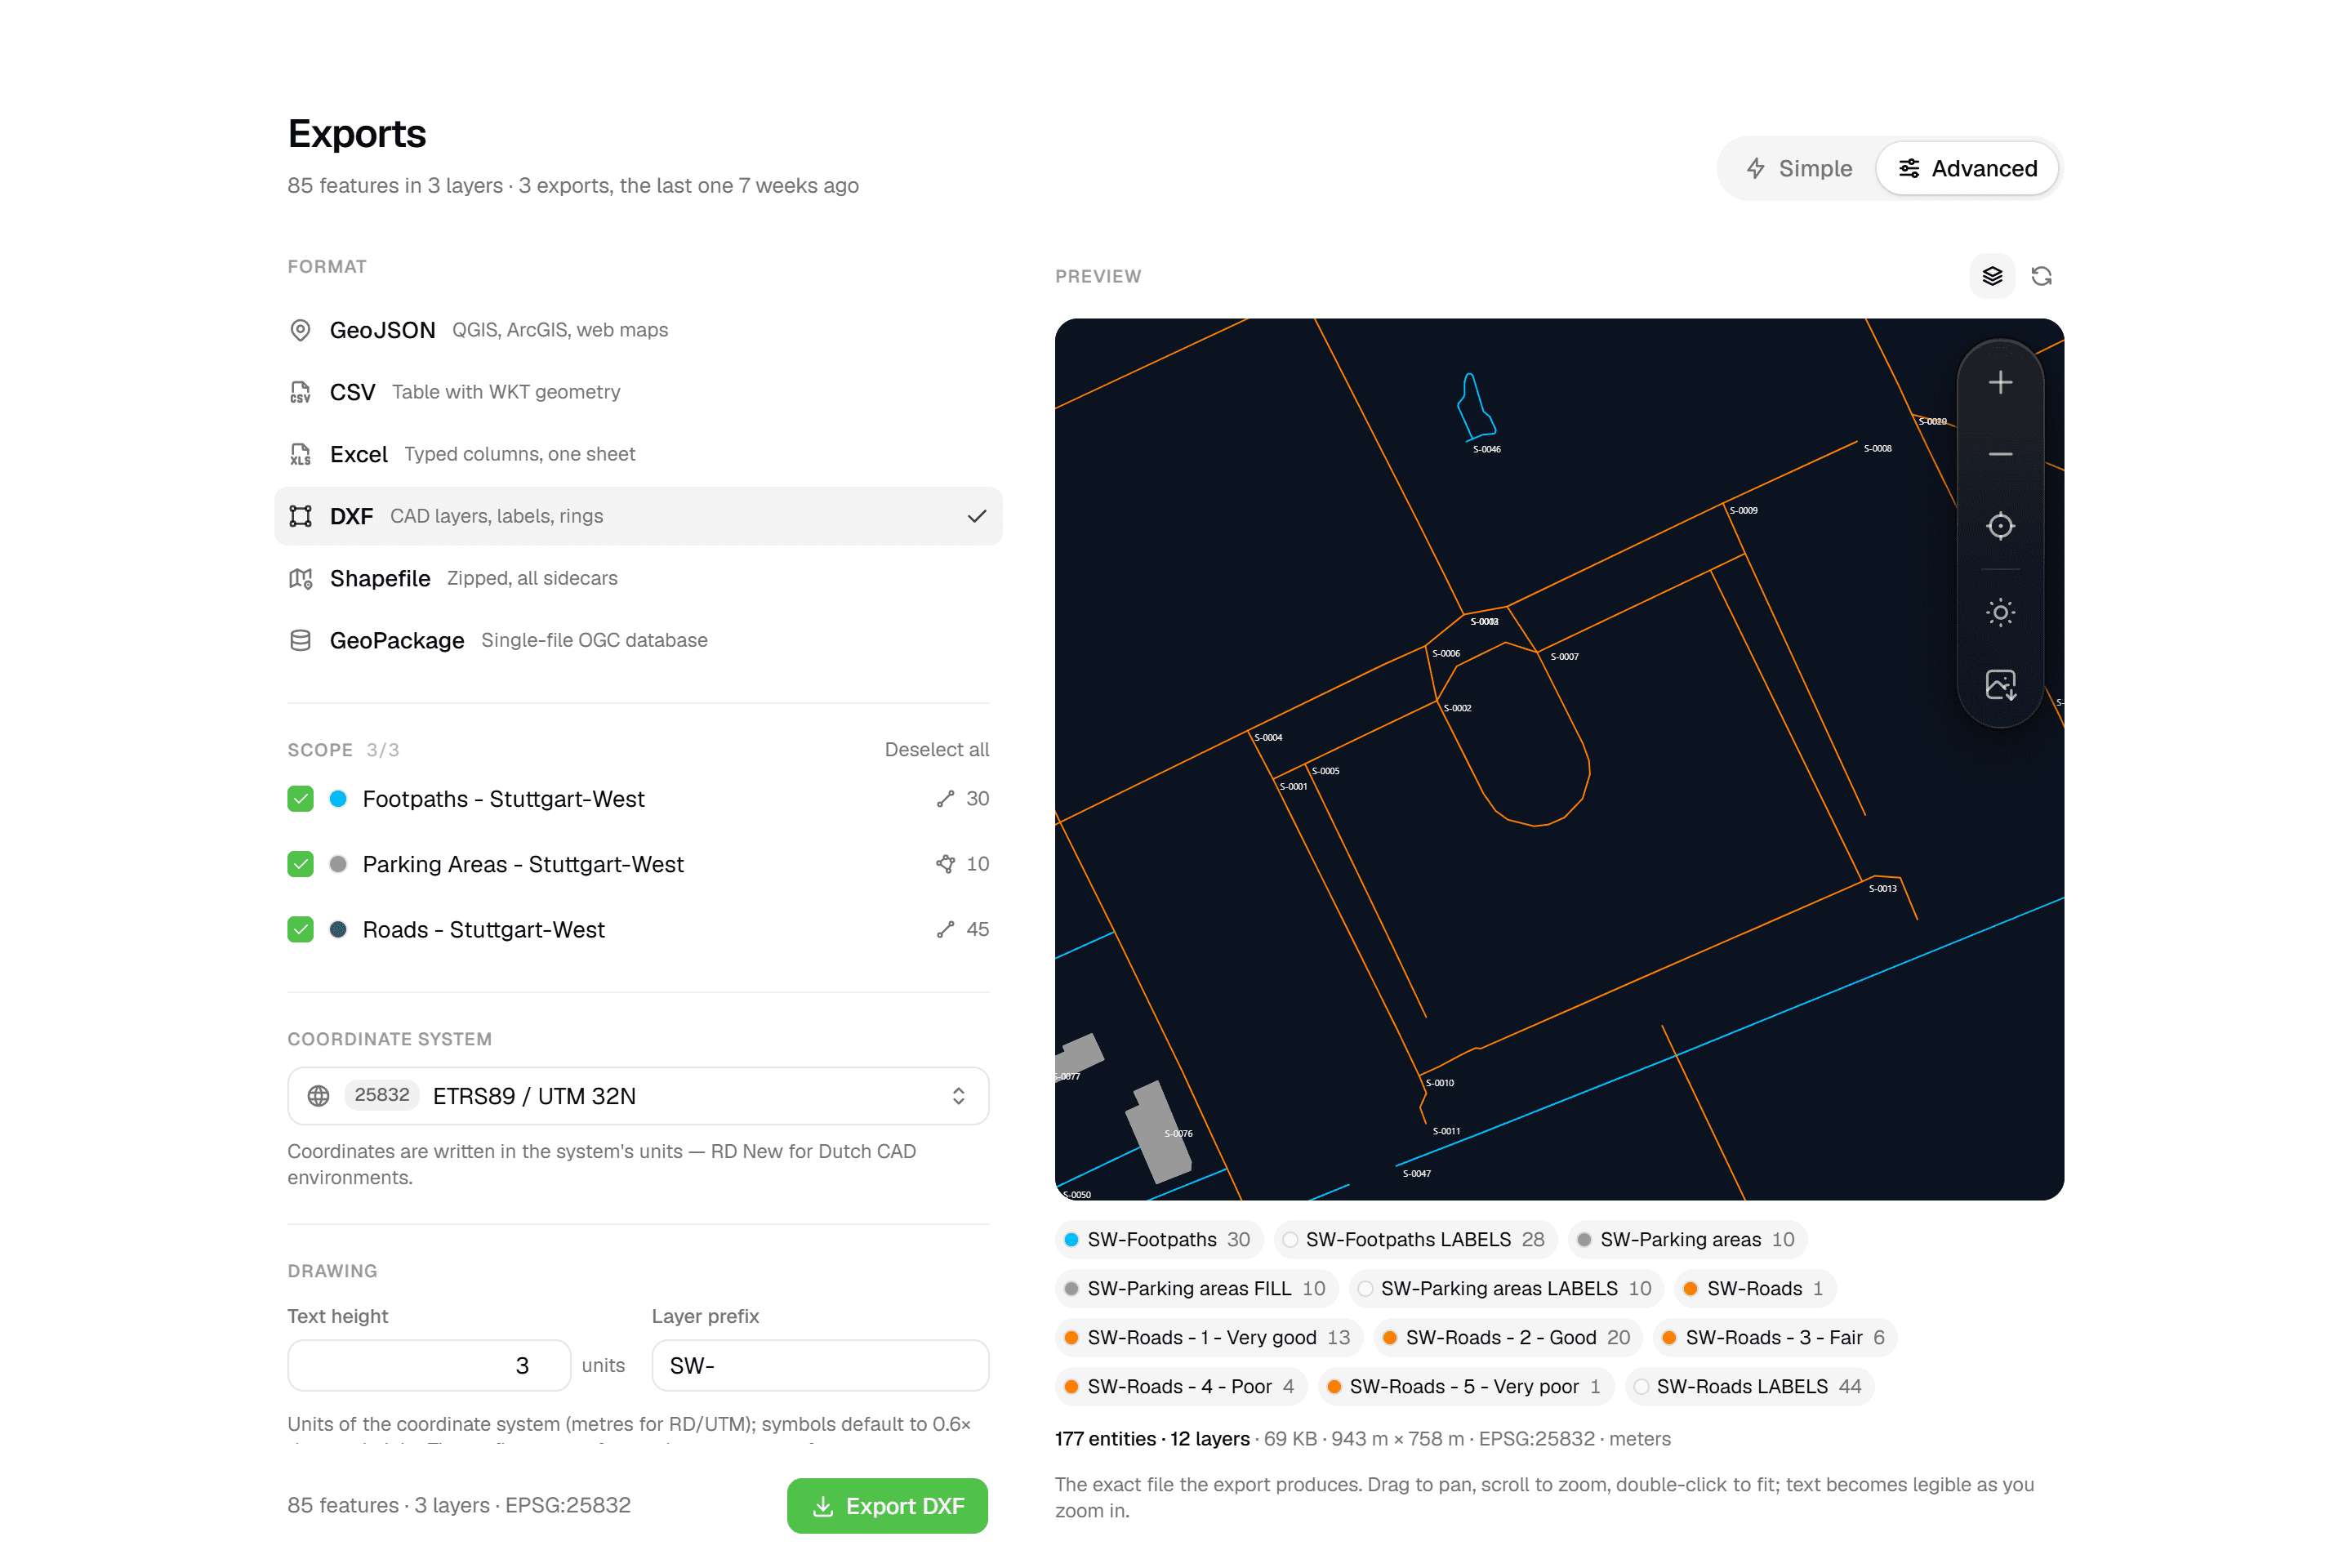 CAD-ready DXF, plus five data formatsLayered DXF with labels, rings and fills, previewed in the browser before you download. GeoJSON, CSV, Excel, Shapefile and GeoPackage on every plan.
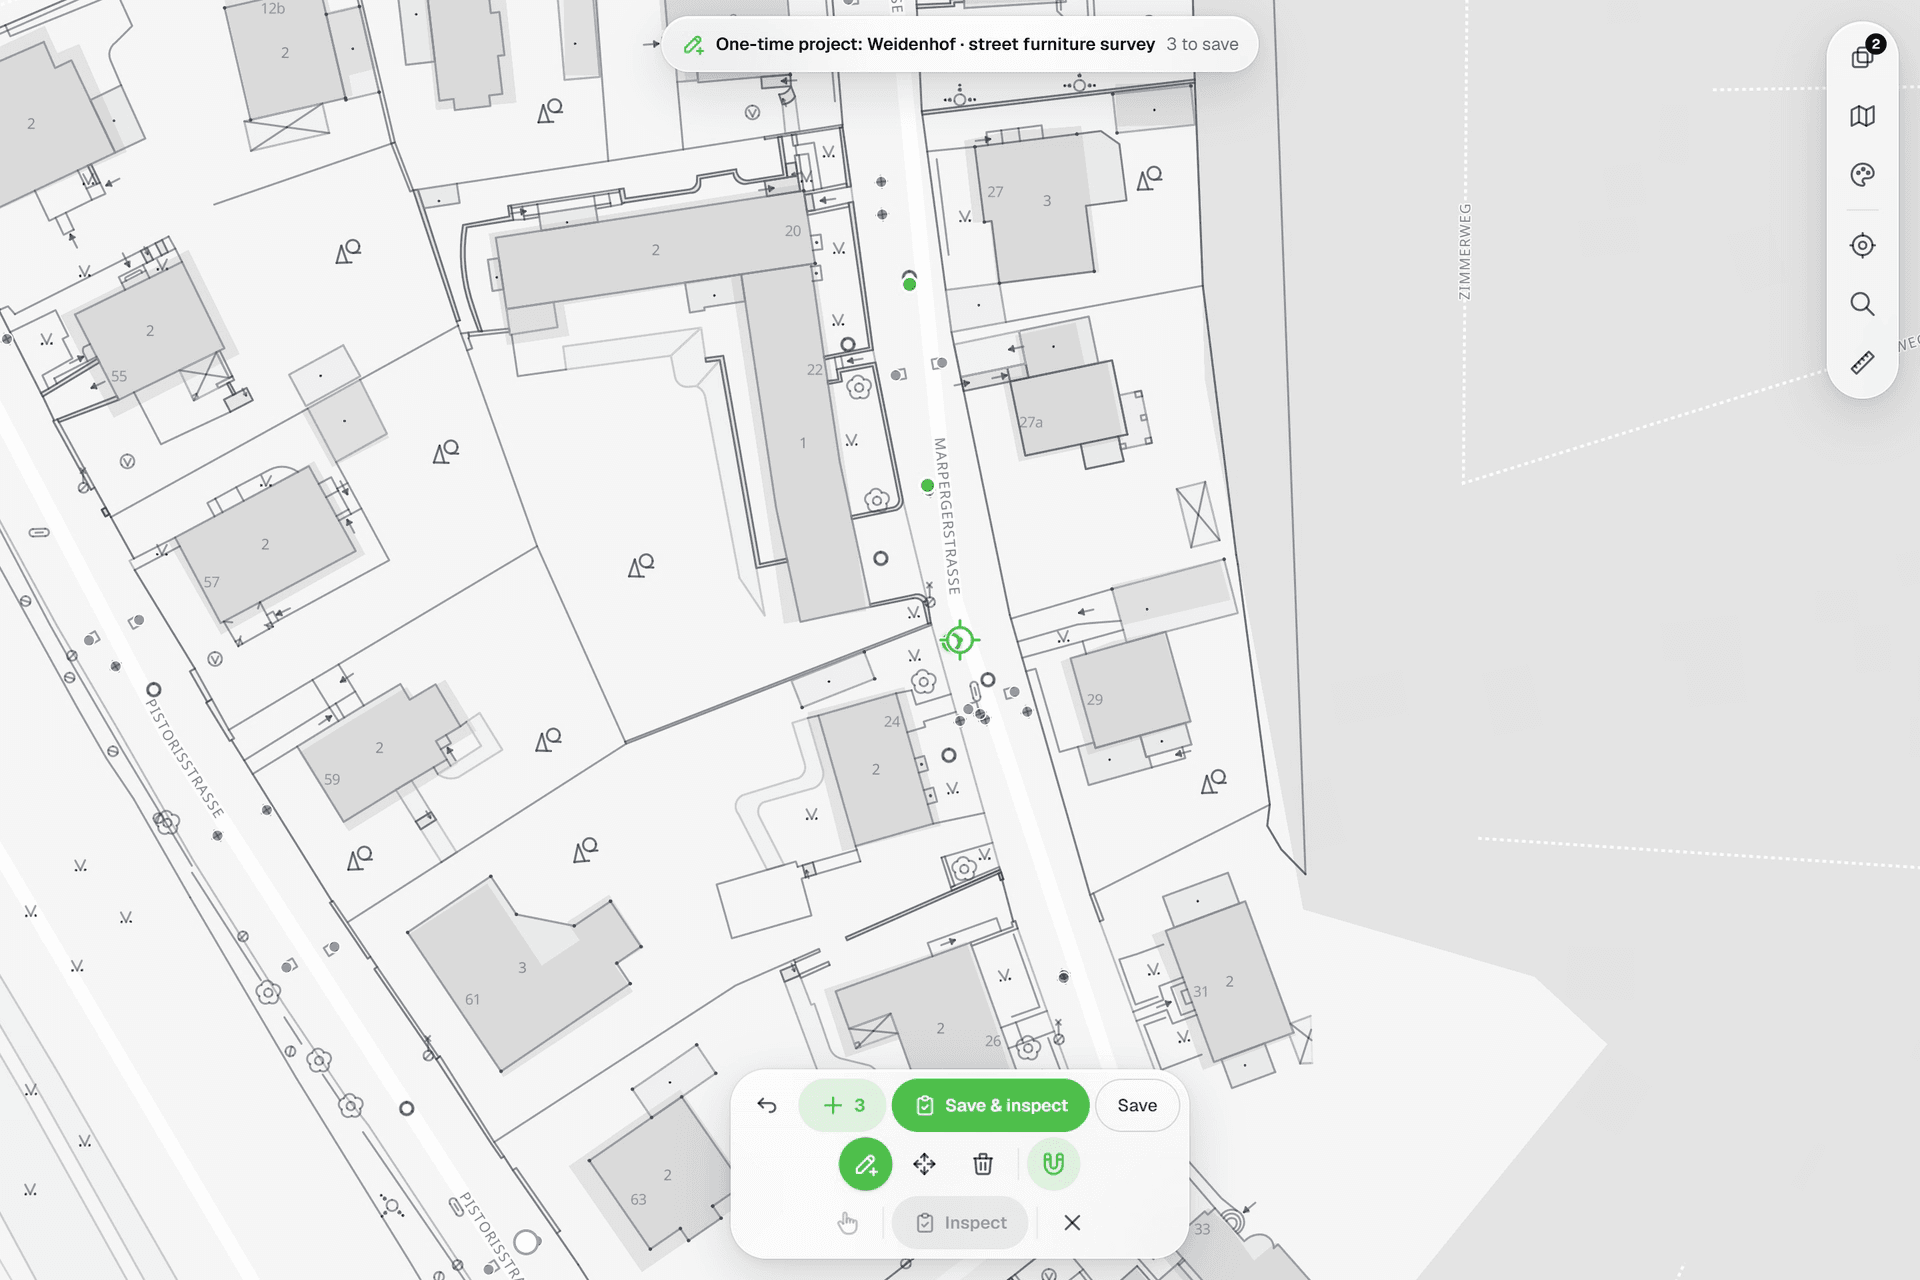 See everything on the mapPoints, lines and polygons over street maps, aerials, BGT and any CAD drawing you upload as reference. Place and correct geometry with a crosshair that snaps to the drawing.
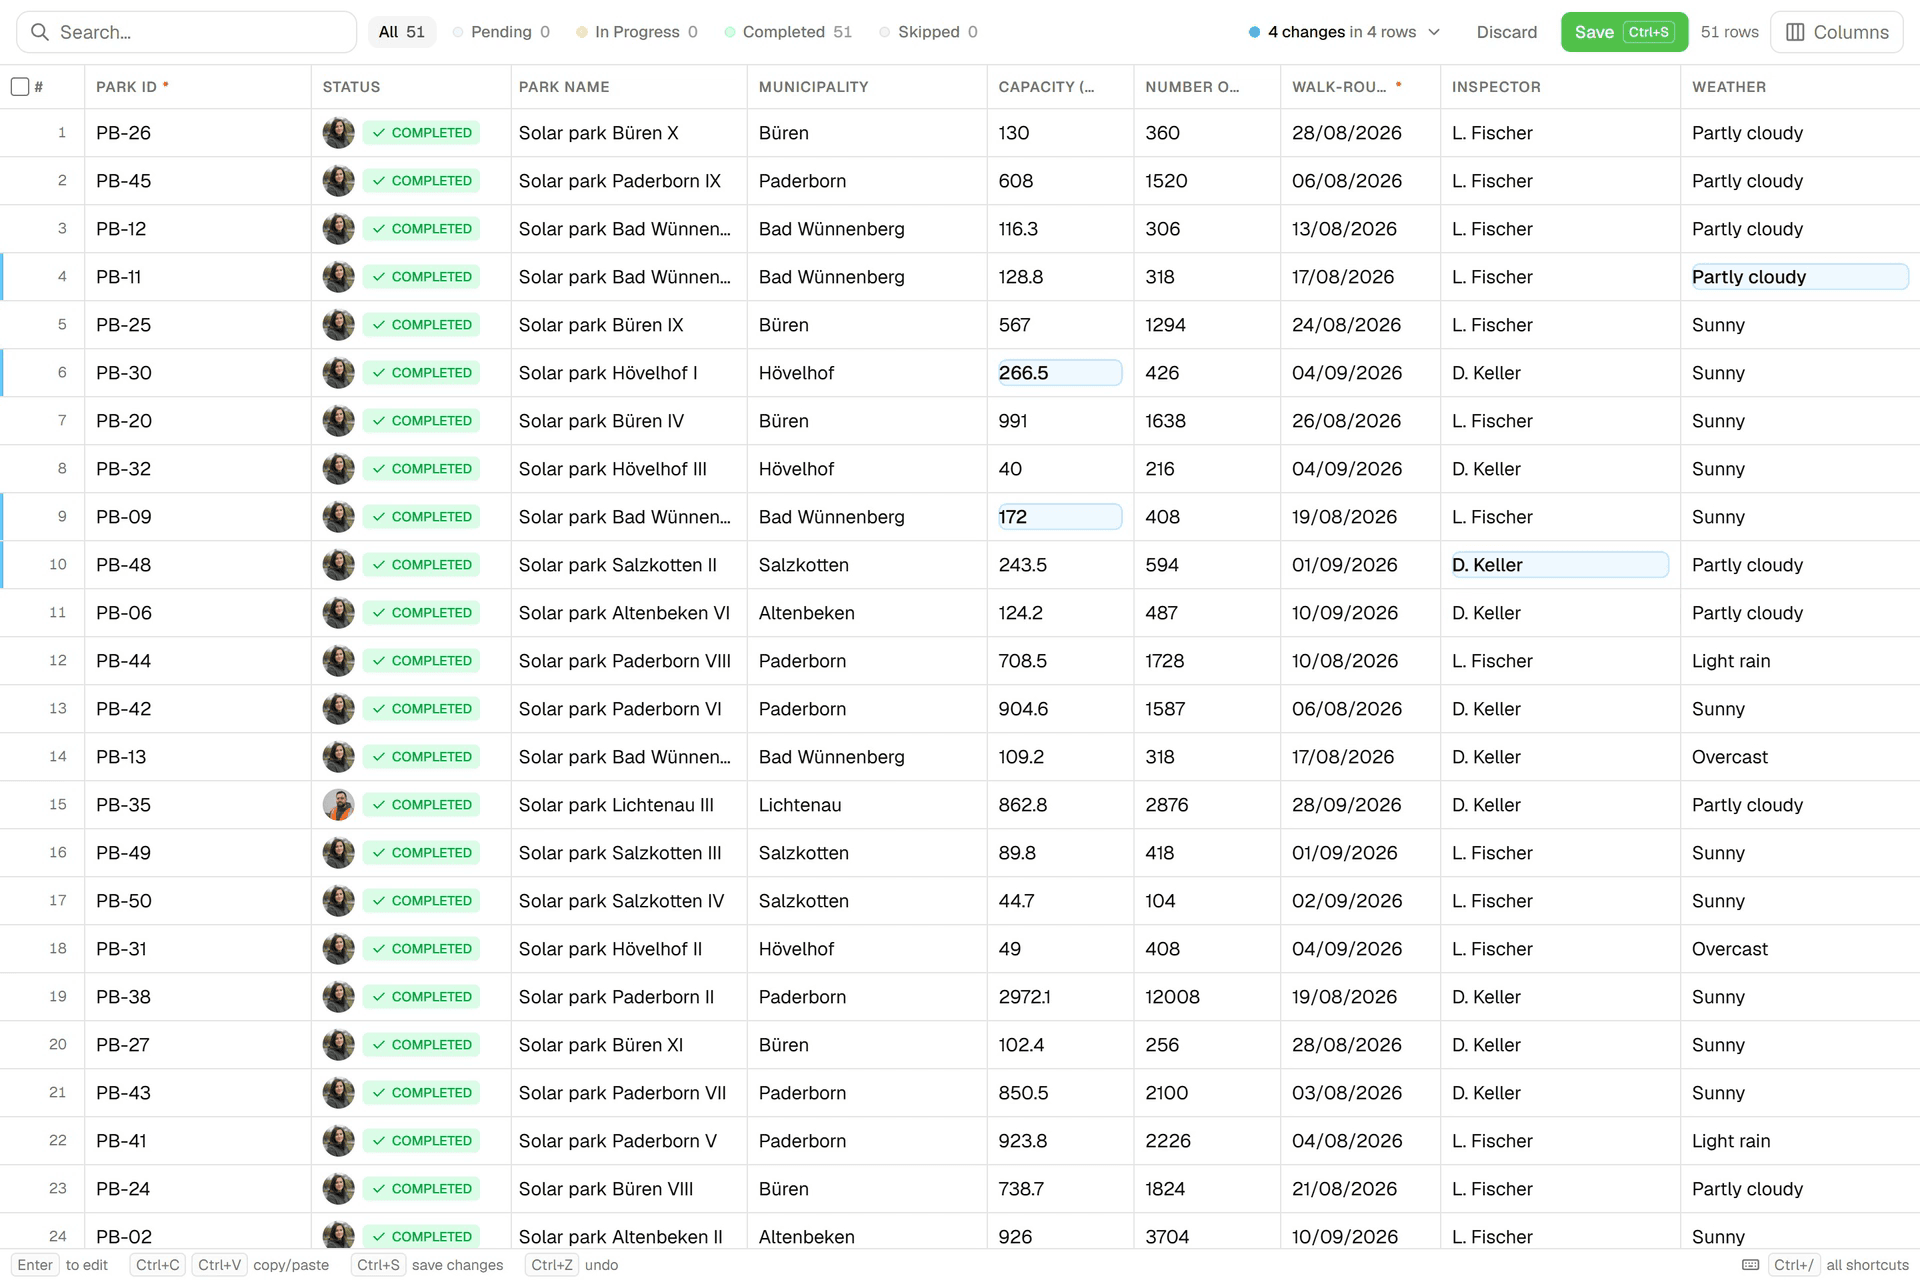 Edit data like a spreadsheetAn Excel-like grid per layer: paste from Excel, fill down, filter, bulk-edit. Review every change before you save; each save lands in the feature's version history.
Try it on your own data
Set up a project and see your own data on the map. Free for 14 days, no credit card.
No credit card requiredFree trial included